


Durban Port Congestion, One Week Later: 28 Ships Waiting and an 18-Day Tail
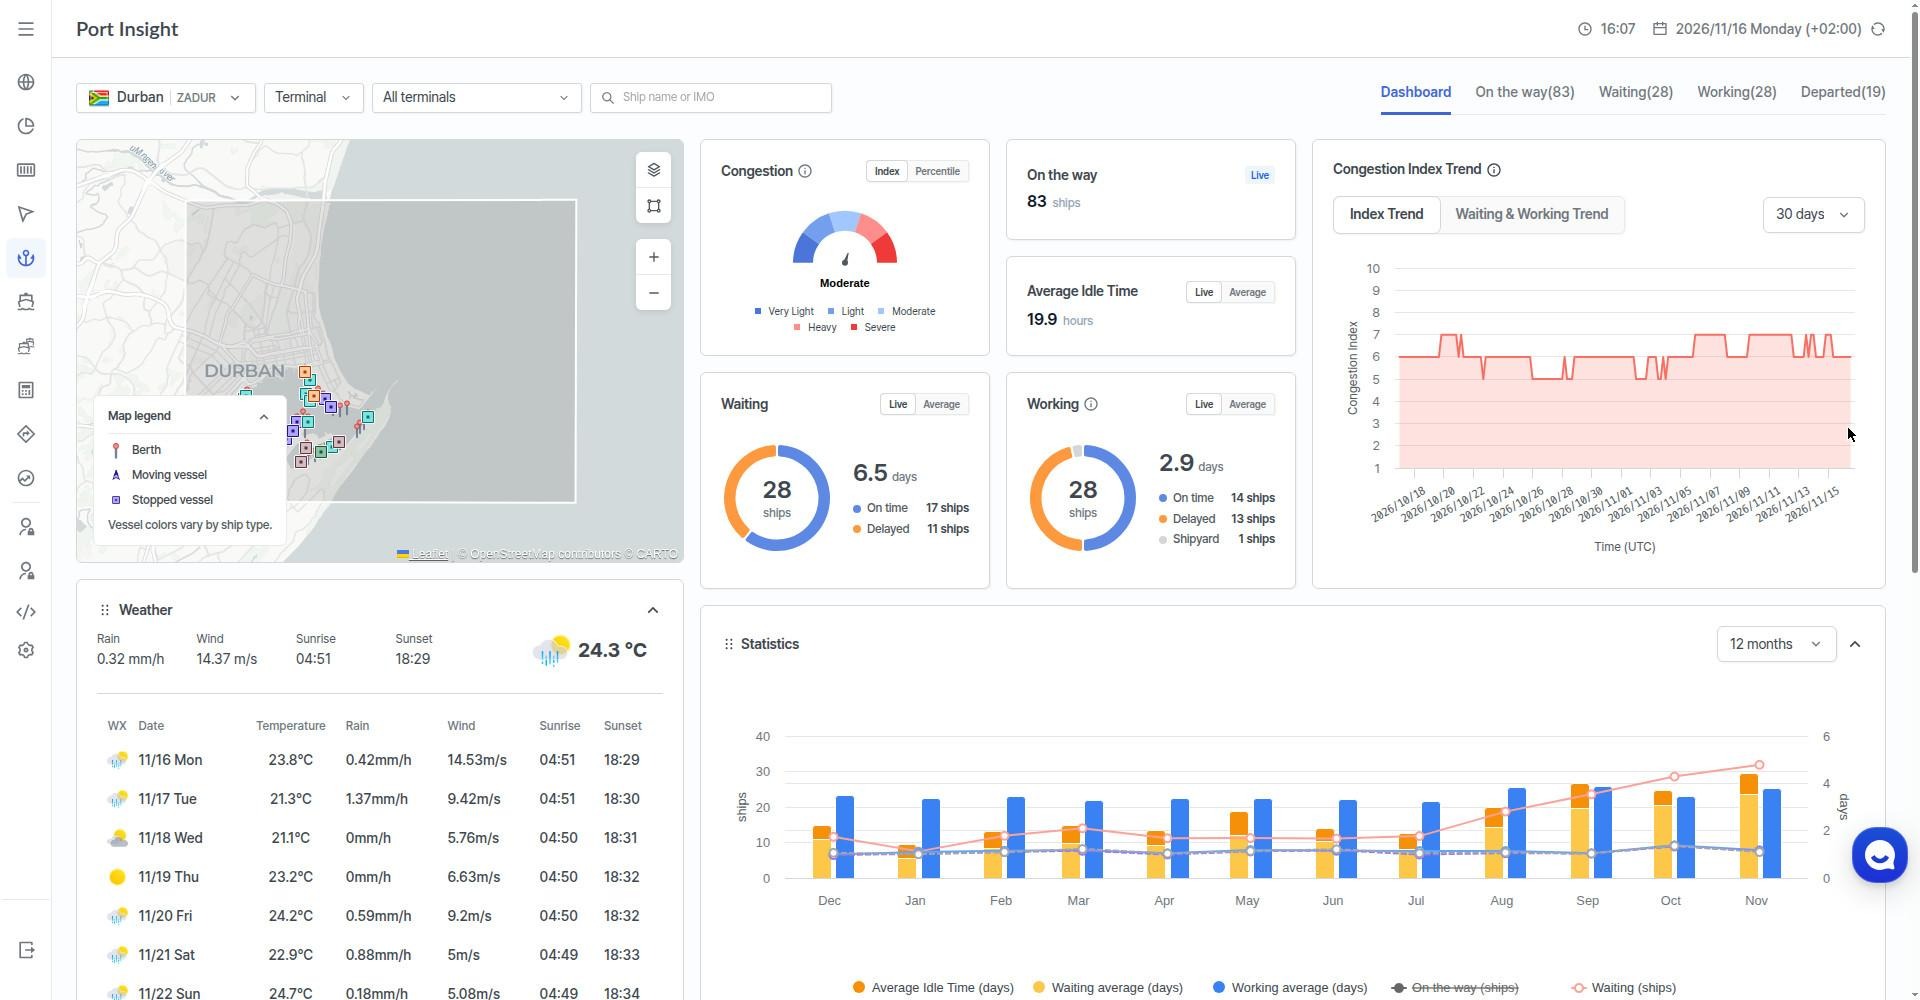
A week ago we wrote that Durban was running 15 days behind. The queue is still there. Port Insight on Monday 16 November shows 28 ships waiting, 6.5 days on average, and 83 more on the way. The congestion index sits at 6 out of 10 — Moderate — and Durban is busier than 77% of ports worldwide. The index has not moved in 30 days. That is the story: not worse, not better. Stuck.
The outside check agrees. Portcast's weekly snapshot for 8–14 November puts Durban's median wait at 6.99 days, still High, up 1.36 days on the week before. Two different measures, same direction. The queue is not easing.
What Port Insight shows now
Live figures from the Durban dashboard, Monday 16 November, 15:53 South African time:
Read the waiting row against its own history. A ship waits 6.5 days today. The one-year average is 1.9 days. Waiting at Durban runs more than three times its own normal. Of the 28 waiting, 17 are on time and 11 are delayed. Of the 28 working, 14 are on time and 13 are delayed, with one in the shipyard.
November throughput still moves. About eight ships a day arrived, berthed, and departed in November on average. The port is not closed. It is slow. The waiting average for November is 3.5 days and the working average is 3.8 days. Ships get through. They wait first.
The average hides the tail
Averages describe the middle. The money sits in the tail. Six container ships in the waiting list show what the tail looks like:
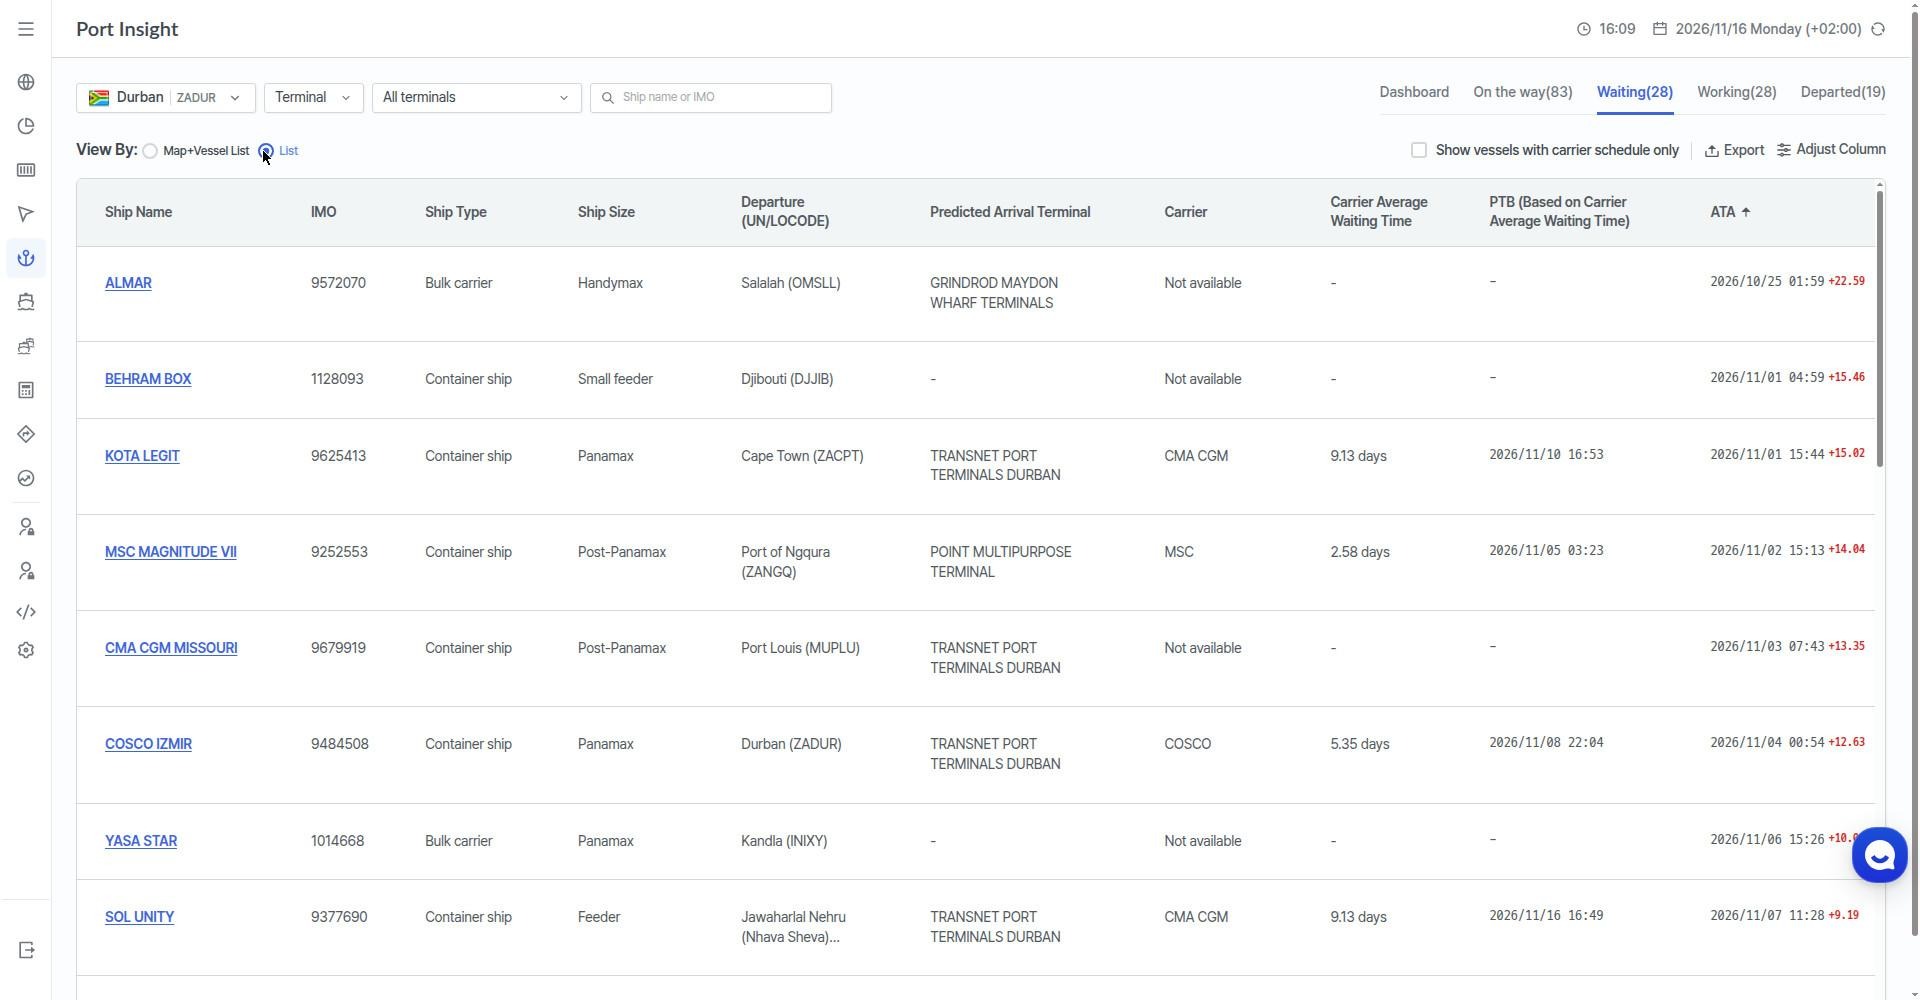
MAERSK STOCKHOLM waited 18 and a half days from arrival to berth. EVER UNICORN waited 16. KOTA LEGIT has waited 15 days and counting. Its predicted berthing time was 10 November. That date passed six days ago. MSC MAGNITUDE VII and COSCO IZMIR missed their predicted berthing times too — 5 November and 8 November. The longest waiter in the whole list is a bulk carrier, ALMAR, at 22.58 days. The queue is not containers only.
The predicted berthing time in Port Insight rests on the carrier's average waiting time. CMA CGM's average is 9.13 days. MSC's is 2.58 days. COSCO's is 5.35 days. A carrier average is not your vessel's wait. MSC MAGNITUDE VII waited 14 days against an MSC average of 2.58. Check the vessel, not the average.
Flat, not falling
The 30-day congestion trend runs from 6 on 17 October to 6 on 16 November. In between it ranged from 5 to 7 — down to 5 around 26–28 October and 2–4 November, up to 7 around 20–21 October, 7–9 November, 11–13 November, and 14–15 November. Flat overall. No easing, no blowout. Durban has held at Moderate for a month.
That flat line is the point. A month ago the story was a terminal switch and a backlog. Now the backlog is the operating level. Transport Minister Barbara Creecy said in late October that Durban Gateway Terminal may return to its former performance between December 2026 and February 2027. Kuehne+Nagel does not expect meaningful improvement before the end of Q1 2027. Nothing in the last 30 days contradicts either statement.
The other South African ports are still the release valve
Same dashboard, same hour, Monday 16 November:
Cape Town waits half a day. Durban waits six and a half. Ngqura waits two days. Port Elizabeth, the lightest of the four at index 3, waits a day and a half. The gap between Durban and Cape Town is 13 times on waiting time.
Cape Town is not better at everything. Its working time runs 4.4 days against Durban's 2.9 — once a ship is alongside, Cape Town works it slower. But the wait to get alongside is the cost that matters, and there Cape Town wins by six days. The trade-off from last week still holds: Cape Town saves time, not money, unless the cargo stays in the Western Cape. The road to Johannesburg is still 1,400 km against 570–600 km from Durban.
Eighty-three ships are coming
The on-the-way list is the next queue. Eighty-three ships are inbound to Durban, with 19.9 hours of average idle time. The pipeline is full. Nothing in the arrivals suggests the waiting list shrinks this week.
One inbound vessel shows why the early signal matters. ONE ATLAS, out of Singapore, carries a carrier ETA of 14:00 on 16 November. Its PTA — SeaVantage's predicted arrival, recalculated from live vessel movement — is 05:11 on 19 November. That is about two and a half days later than the official ETA. MSC SARAH V shows the same pattern on a smaller scale: ETA 04:00 on 17 November, PTA 12:01 on 18 November.
The PTA is not a replacement for the carrier's ETA. It is a complementary signal. When it moves later than the ETA, treat it as an early warning: pre-check trucking, hold warehouse flexibility, draft the customer note. Do not wait for the official update to catch up. A two-and-a-half-day gap found on Monday is a plan. Found on Thursday, it is a scramble.
What it still costs
The November charges still stand. Maersk's peak season surcharge — $1,000 per 20ft, $2,000 per 40ft from Far East Asia to South Africa — runs until further notice. The Durban congestion fee — $400 per 20ft on China-origin cargo, $450 from the rest of Far East Asia — runs with it. Together they add $1,400 to a 20ft box from China. The cost table from last week still applies. Nothing new has superseded it.
One relief still runs. Maersk raised import detention free time at all Durban terminals from four to five days, valid until 31 December 2026. The standard four days resume on 1 January. Confirm it on your booking, not on the advisory.
How to read Port Insight before you book
- Check the index and the percentile. Durban at 6 and the 77th percentile means busier than most ports, not just busy. A port at 5 and the 52nd percentile, like Ngqura, is a different booking.
- Compare live waiting with the averages. Live waiting of 6.5 days against a one-year average of 1.9 days says the port is running hot right now. Live waiting near the one-year average says it is a normal week.
- Open the waiting list and find your carrier. The carrier average waiting time sets the predicted berthing time. CMA CGM's 9.13 days and MSC's 2.58 days are not the same queue. Then check the actual vessels: if three of them already missed their predicted berthing, expect yours to slip too.
- Check the on-the-way list. Eighty-three inbound ships means the queue has a next wave. A short waiting list with a long inbound list is a queue about to grow.
- Compare the PTA with the ETA. If the PTA runs days behind the ETA, act on Monday, not on arrival day.
Frequently asked questions
What is Durban's congestion index right now?
Port Insight puts Durban at 6 out of 10 — Moderate — and busier than 77% of ports, as of Monday 16 November 2026. The index has held between 5 and 7 for 30 days.
How long are ships waiting at Durban?
Twenty-eight ships are waiting, 6.5 days on average, live. The seven-day average is 4.0 days. The longest waits run past 15 days, and one vessel took 18.53 days from arrival to berth.
Is Durban getting better?
No. The congestion index is flat over 30 days, and Portcast's median wait rose 1.36 days week on week to 6.99 days for 8–14 November. Recovery is still dated December 2026 to February 2027 at the earliest.
Which South African port is least congested?
Port Elizabeth, at index 3 and Light, with 1.5 days of waiting. Ngqura and Cape Town sit at index 5, Moderate, with 2.0 and 0.5 days of waiting. Durban is the outlier on waiting time.
Do the November surcharges still apply?
Yes. Maersk's peak season surcharge of $1,000 per 20ft and the Durban congestion fee of $400 per 20ft on China-origin cargo both run until further notice. Maersk's extra day of detention free time ends 31 December 2026.
Can tracking cut the cost of the Durban queue?
Tracking cannot remove a surcharge the carrier has announced. It can cut your exposure: book on the right price calculation date, route around a congested port, watch the vessel live instead of trusting the service name, and act on delay signals early enough to avoid demurrage, detention, and rush fees on top of the surcharge.
Related reading
- Durban Port Congestion November 2026: Maersk's $1,000 Surcharge and a 15-Day Queue
- CMA CGM Surcharges November 2026: Three New Charges — and How Tracking Cuts the Bill
- Port Congestion Is the New Normal. Plan Like It Is.
- Mass Vessel Rerouting Is Triggering Global Port Congestion — Here's What It Means for Container Visibility
The takeaway
Durban did not get worse this week. It did not get better either. Twenty-eight ships wait 6.5 days. Eighty-three more are coming. One vessel took 18 and a half days to berth, and three more missed their predicted berthing times. The surcharges from last week still stand. Check the port before you book it. The dashboard shows the queue. Use it.
Data note: All Port Insight figures are from the live dashboard on Monday 16 November 2026, header time 15:53 South African time (Durban) and 15:57–15:58 (comparison ports). The congestion gauge shows the band label; the index value 6 comes from the 30-day trend chart for 16 November. November arrived/berthed/departed figures are daily averages from the 12-month statistics panel. Waiting and working averages are as labelled on the dashboard.


팬스타 아크로호가 지난 8월 22일 북극항로 시범운항을 시작했습니다. 국내 최초 컨테이너선 북극항로 운항 현황과 상업성 검증 항목, 화주·포워더가 주목할 사항을 정리합니다.

태풍 발생 시 선박은 우회·감속·대기 등 서로 다르게 대응합니다. AIS 항적과 ETA·PTA·PTB, 항만 혼잡 데이터를 활용해 해상운송 지연 가능성을 판단하는 방법을 알아보세요.

Forwarders need one dashboard per client, not one login per carrier. What to check — and how SeaVantage Cargo Insight covers it.

One week on, Port Insight shows 28 ships waiting 6.5 days at Durban, 83 on the way, and one vessel that took 18.5 days to berth.
Half of all container ships arrived late in September. Contracts can't enforce on-time delivery. Here's how shippers de-risk schedules anyway.


