


Port Congestion Is the New Normal. Plan Like It Is.
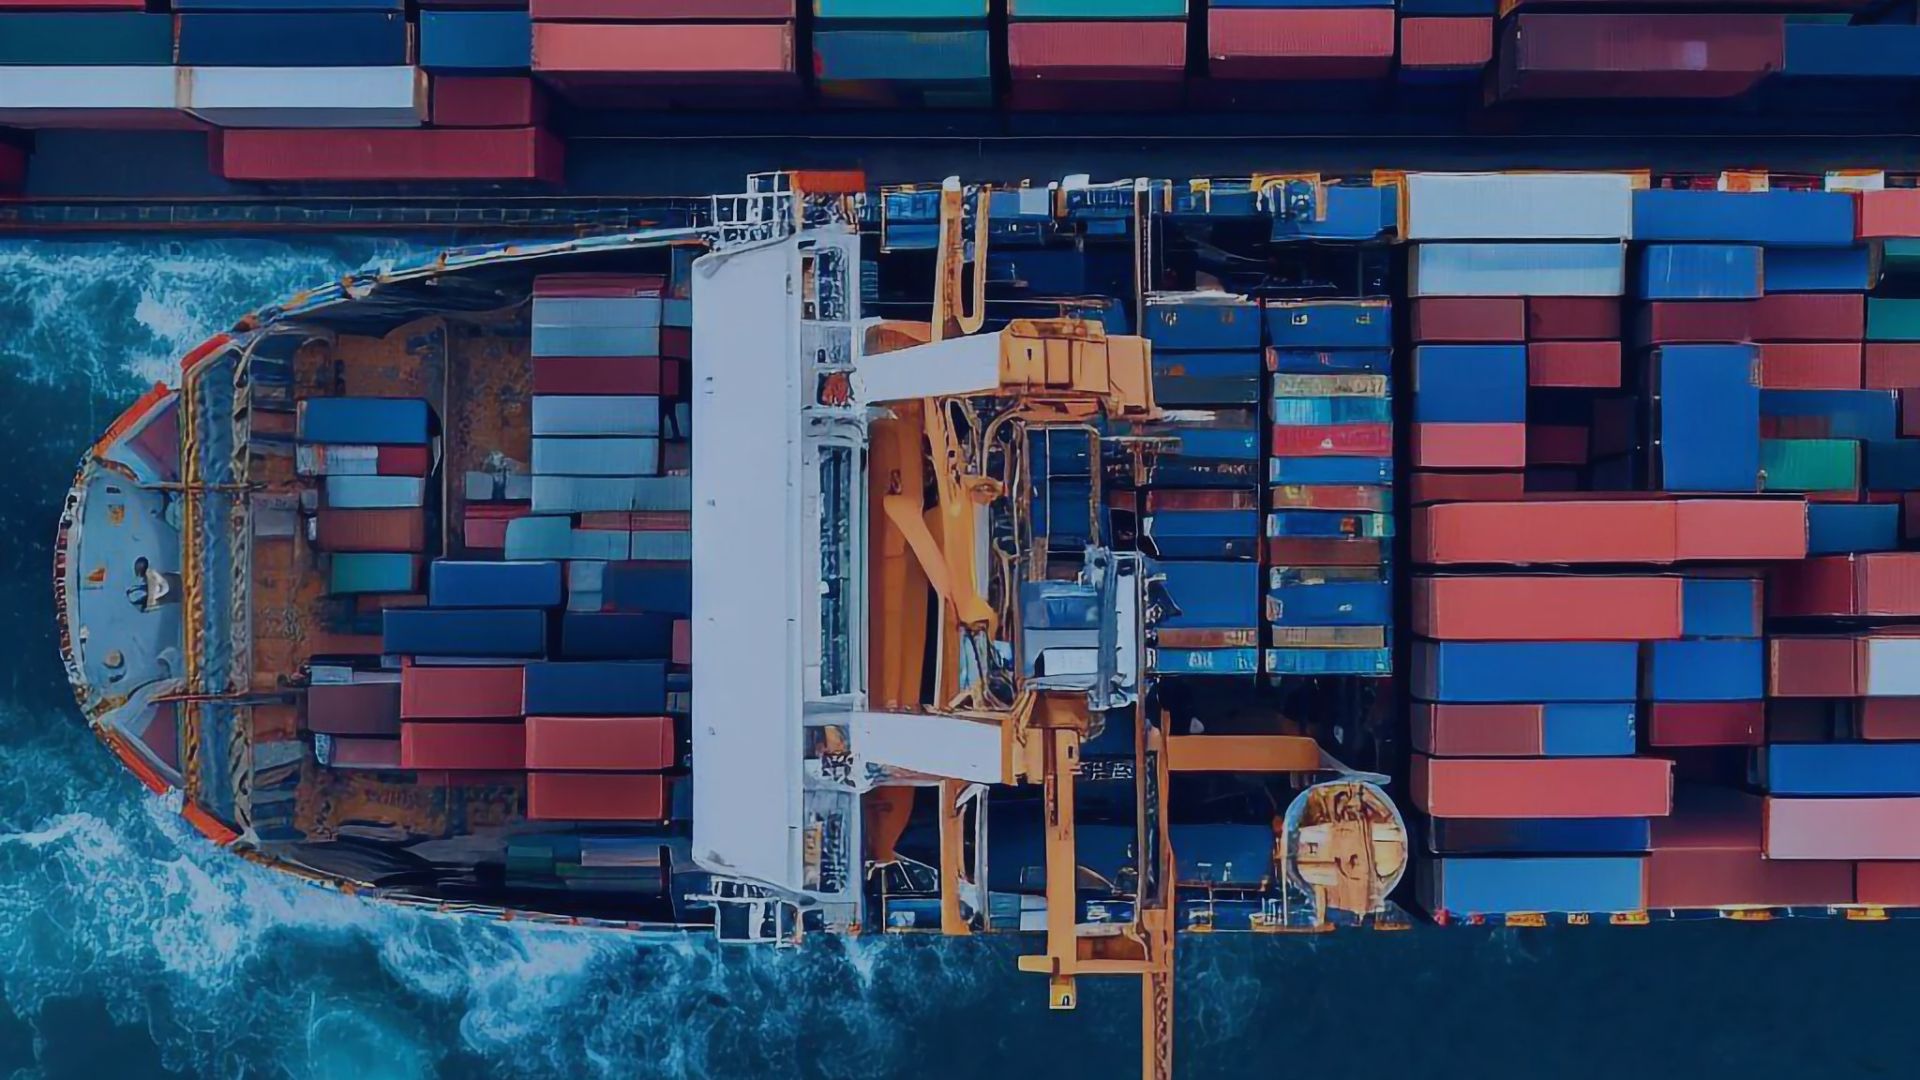
The head of the world's largest container line says port congestion is here to stay. MSC chief executive Soren Toft put it plainly: port congestion has become a new normal in the industry. The numbers back him. More than 4.3 million TEU of containership capacity sat tied up in congestion in August. That beat the pandemic record. Ships waited more than two days on average at Shanghai and Ningbo last week. Yards in Tokyo ran above 100% full. This is not a spike. It is the operating picture.
What Toft said
Toft made the point in a quarterly update on LinkedIn. "Port congestion has become a new normal in our industry, and geopolitical uncertainty remains," he wrote. His message to carriers: stay agile. The warning matters because MSC runs the world's largest container fleet — 7.48 million TEU, 21.5% of the world fleet, per Alphaliner. When its chief executive calls congestion permanent, he is telling the market to stop waiting for normal to return.
The record, and the caveat
Consultancy Linerlytica calculated that more than 4.3 million TEU of containership capacity was tied up in congestion during August. The previous absolute record was 4 million TEU, set during the pandemic. The new high passed it.
One caveat keeps the picture honest. The global fleet is bigger now. The 4.3 million TEU equals 12.6% of a fleet totalling 34.4 million TEU. In 2022, the 4 million TEU peak equalled 15.7% of a 25.3 million TEU fleet. The absolute record is real. In relative terms, congestion is still below the pandemic peak. The point stands either way: more ships than ever are stuck waiting, and the fleet has grown to absorb it.
The yards tell the story
Waiting times are only half the picture. The yards are full. Terminal occupancy — how many containers sit in a yard waiting for a truck or a vessel — runs far above what the terminals were built to handle.
A yard above 100% means containers stack where they should not. Moves slow down. Trucks queue. Ships wait longer. Busan's BNCT terminal shows the strain: laden density sits near 100%, and heavy-discharge ships risk lower priority.
Drewry put a number on why full yards hurt so much. Clearing a terminal that runs above 85% utilisation takes far longer than clearing one at 70%. A one-day closure at 70% clears in two days. At 85% or more, it takes a week. Hit it with a second disruption and it may never fully clear. Most of the big Asian gateways now sit above that line.
Why it keeps happening
Congestion feeds on itself. Sea-Intelligence found that vessel bunching in Asia pushed departures originally scheduled for the third quarter into October and November. That drove deployed capacity on major east-west trades to unprecedented levels. Ships that should have sailed weeks apart now arrive together.
The bunching also broke carriers' capacity plans. During China's Golden Week holiday, carriers normally blank sailings — skip voyages to match low demand. This year, delayed vessels sailed late instead, creating "double sailings": two departures on one service in a week. Deployed capacity during the holiday period hit record levels on the transpacific and Asia–Europe trades. The Asia–US west coast trade saw 393,000 TEU a week, against a normal Golden Week level below 300,000 TEU. The extra ships did not clear the backlog. They added to it.
Smaller ports feel it too. The Loadstar reported that Ho Chi Minh City's average vessel waiting time rose from eight hours to 22 hours in a fortnight. Jakarta's Tanjung Priok struggles with sudden, unscheduled multi-ship arrivals that overwhelm roads and depots already at full capacity. Intra-Asia rates stay high because the ships cannot turn around fast enough.
What this means for shippers
Stop planning around the schedule. Plan around the queue.
ETAs will slip. A vessel that waits two days at Shanghai arrives two days late at the next port — or later, if the next yard is full too. The carrier ETA updates when the ship moves. It does not warn you while the ship sits at anchor.
Dwell time will rise. Full yards mean containers sit longer after discharge. Demurrage and detention clocks keep running. A box that cleared in three days last year may take five now.
Customers will ask first. When a shipment is late, the customer calls you before the carrier calls you. The forwarder who can say where the box is, and when it will move, keeps the account. The one who waits for the carrier's next update does not.
What shippers should do now
Congestion is the baseline. Work with it.
Check the port before you route. Port Insight shows congestion, schedules, waiting times, and port-call records. Check the load port and the discharge port before you book. A lane that looks cheap on paper costs more when the ship waits two days at each end. See Shanghai port congestion tracking, Ningbo port congestion tracking, Singapore port congestion tracking, Busan port congestion tracking, and Rotterdam port congestion tracking for the ports in this story, or the global port congestion tracker for the full picture.
Watch the vessel, not just the booking. Ship Insight tracks vessels by name, IMO, or MMSI, with live AIS position, ETA, and port calls. When a ship sits at anchor off Shanghai for two days, the live position shows it. The booking status does not. For the largest carrier in this story, see MSC container tracking.
Watch the box too. Cargo Insight tracks containers by B/L, booking, or container number, with milestone updates and delay-risk signals. Its PTA works as an earlier, complementary signal alongside the carrier ETA — never a replacement, never a claim of better accuracy. When bunching pushes your sailing a week late, the milestones show the shift while you can still warn the customer. See ETA vs PTA in container shipping and how to read SeaVantage's PTA and carrier ETA in real-world scenarios.
Compare port pairs before you commit. Schedule Insight searches port pairs and compares carriers on reliability and transit time from real voyages. If Shanghai waits run past two days, a sailing through a less crowded gateway may arrive sooner — even on a longer route. Check the options before you sign the next booking.
Build buffer into every promise. Add the wait to the transit time. Tell the customer the realistic date, not the scheduled one. A promise kept late beats a promise broken on time.
For background, see the CMA CGM surcharges post and the Durban port congestion post. For the tools, read best port congestion tracking software in 2026 and 5 proven ways to reduce dwell time with SeaVantage data. For the Busan angle, see the Busan port guide. For the wider picture, read how geopolitics will reshape global shipping in 2026. See pricing for SeaVantage plans.
FAQ
Is port congestion really worse than during the pandemic?
In absolute terms, yes. More than 4.3 million TEU of containership capacity was tied up in August 2026, above the 4 million TEU pandemic record, according to Linerlytica. In relative terms, no: 12.6% of today's larger fleet, against 15.7% in 2022. Either way, the system is under more strain than at any point since Covid.
Which ports are worst hit right now?
Tokyo's Aomi terminal ran at 113% yard occupancy, Yokohama above 100%, and Tokyo's Ohi at 97%, according to Kuehne+Nagel's update for November 4–10. Busan's BNCT sat around 95%, Rotterdam's ECT at 94%. Average vessel waits ran 2.28 days in Shanghai, 2.25 days in Ningbo, and 1.7 days in Singapore.
Why do full yards cause so much delay?
A terminal above 85% utilisation clears slowly. Drewry's analysis: a one-day closure at a 70%-utilised terminal clears in two days. At 85% or more, it takes a week. Stacked containers need extra moves to reach the one underneath. Trucks queue. Ships wait for a berth that never frees up.
What is vessel bunching?
Ships scheduled to sail weeks apart arrive together because earlier delays pushed them late. Sea-Intelligence found Q3 departures bunched into October and November, driving deployed capacity on major east-west trades to unprecedented levels. Carriers' blank sailings could not offset it — delayed ships sailed late instead, creating double sailings.
How can a shipper see congestion before it hits their cargo?
Check the port before booking. Port Insight shows congestion, schedules, waiting times, and port-call records for the load and discharge ports. Track the vessel live and the container by B/L or booking number, so a two-day wait at anchor shows up while there is still time to warn the customer or reroute.
Will congestion ease soon?
No one in the data says so. MSC's chief executive calls it a new normal. Sea-Intelligence expects the bunched capacity to keep arriving through November. Drewry's clearing math says full yards recover slowly. Plan for congestion as the baseline, not the exception.
Related reading
- CMA CGM Surcharges November 2026
- Durban Port Congestion November 2026
- Best Port Congestion Tracking Software in 2026
- 5 Proven Ways to Reduce Dwell Time With SeaVantage Data
- B2B Shipping Busan Port Guide
- How Geopolitics Will Reshape Global Shipping in 2026
The takeaway
The largest carrier in the world says congestion is permanent. The data agrees: a record 4.3 million TEU stuck, yards above 100%, ships waiting days at the biggest ports in Asia. The shippers who adapt will check the port before they book, watch the vessel live, and give customers dates they can keep. The rest will keep promising the schedule — and keep missing it.

팬스타 아크로호가 지난 8월 22일 북극항로 시범운항을 시작했습니다. 국내 최초 컨테이너선 북극항로 운항 현황과 상업성 검증 항목, 화주·포워더가 주목할 사항을 정리합니다.
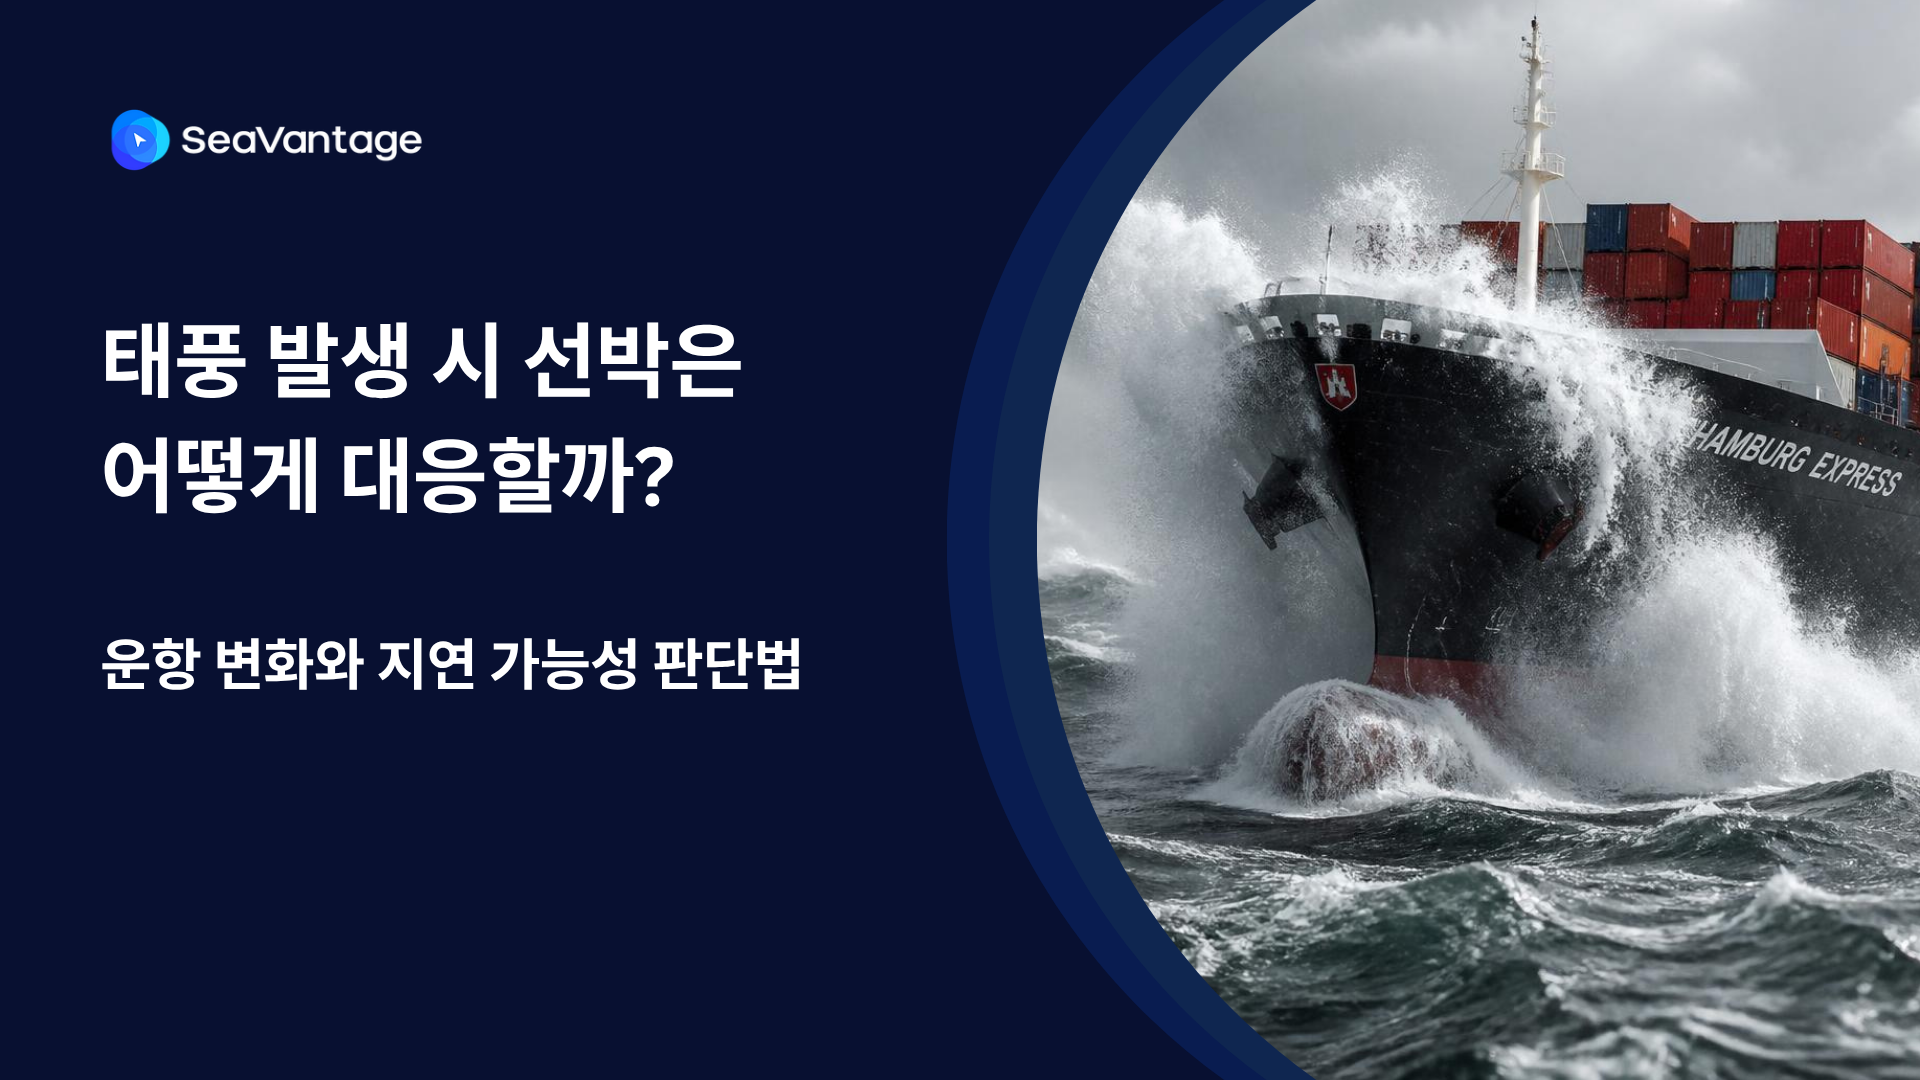
태풍 발생 시 선박은 우회·감속·대기 등 서로 다르게 대응합니다. AIS 항적과 ETA·PTA·PTB, 항만 혼잡 데이터를 활용해 해상운송 지연 가능성을 판단하는 방법을 알아보세요.
Half of all container ships arrived late in September. Contracts can't enforce on-time delivery. Here's how shippers de-risk schedules anyway.

MSC's CEO calls port congestion the new normal. Over 4.3m TEU sat stuck in August — a record. What shippers should do when delays stop being the exception.

Durban's queue hit 15 days and Maersk's peak season surcharge quadrupled to $1,000 per 20ft on Nov 9. What it costs, and how tracking helps.


