
5 Critical Insights on Port Congestion and Vessel Efficiency (November 2025 Data)
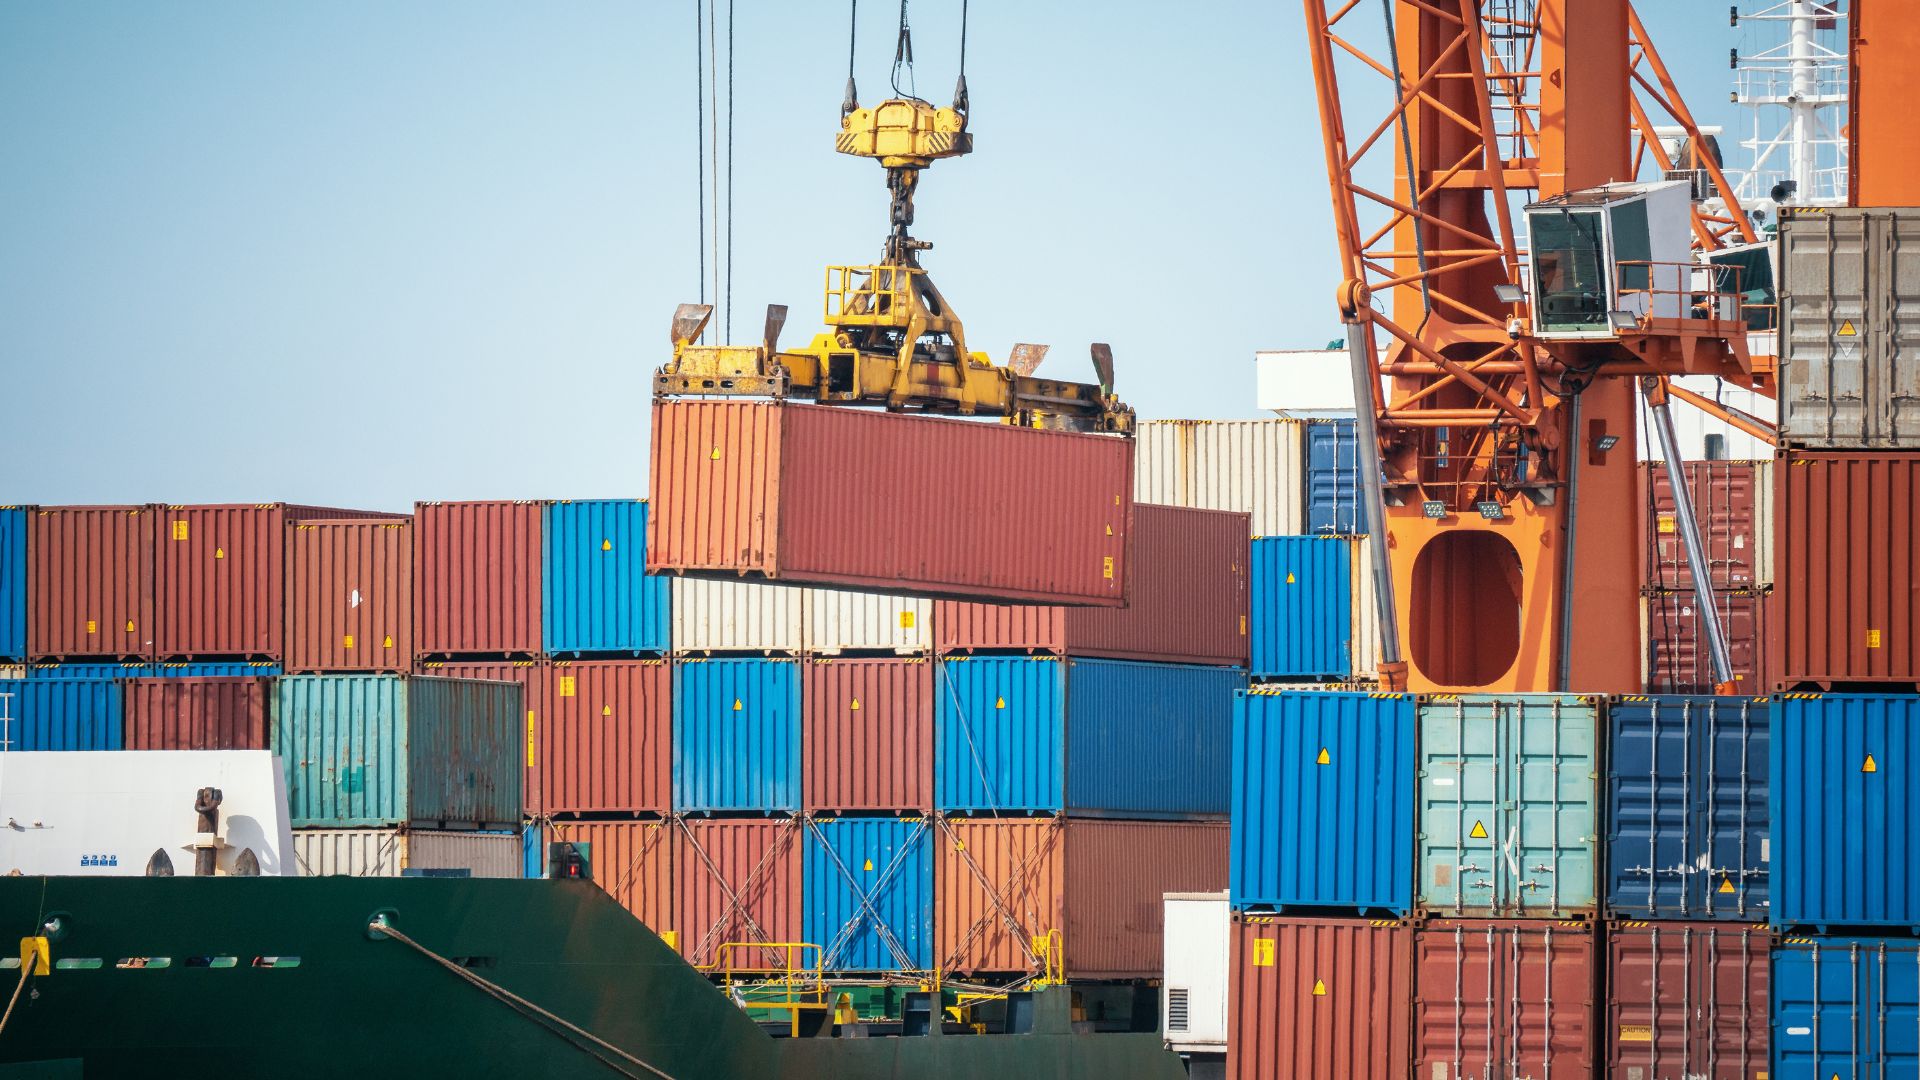
Unpredictable port dwell times are a primary driver of cost overruns and network instability in global logistics. A container sitting idle at a port costs money, strains relationships, and disrupts downstream planning. A critical, yet often overlooked, metric for measuring this efficiency is "vessel dwell time", the total time a ship spends at a port, from arrival to departure.
A new analysis of November 2025 data from the SeaVantage "Container Vessel Dwell Time Dashboard" reveals some leaders and laggards in the industry. These five key takeaways highlight the dramatic performance differences across major global gateways and carriers, providing crucial intelligence for logistics professionals.
Click Here to View the Interactive Report
1. The Efficiency Champion: Busan Leads the Pack
The Port of Busan demonstrated exceptional performance in November 2025, recording the lowest overall vessel dwell time among the 10 major ports analyzed. With a total dwell time of just 19.6 hours, Busan stands out. As one of the world's most critical transshipment hubs, this level of efficiency is not just impressive, it's essential to maintaining fluidity in global trade flows. This performance provides a distinct competitive advantage, reducing delay risks and making Busan an attractive gateway for time-sensitive cargo.
2. The Congestion Hotspot: Los Angeles Faces Major Delays
In stark contrast, the Port of Los Angeles was the highest dwell time port in the November analysis. Vessels here experienced a total dwell time of 79.1 hours, more than four times longer than in Busan. This figure positions the port as a critical bottleneck for supply chain planners, highlighting a potential vulnerability that could significantly impact network resilience and on-time performance.
3. The Longest Wait: Maersk Experiences Significant Delays in Savannah
This finding focuses on "waiting time," the idle period a vessel spends waiting for a berth before cargo operations can begin. This metric represents pure, non-productive cost. In November, Maersk A/S logged the highest average waiting time at a single port: 40.1 hours at the Port of Savannah. That is nearly two full days where an expensive vessel and its crew sat idle before any value-generating work could begin. This kind of delay is a significant red flag, signaling not only potential berthing congestion but also raising the risk of downstream demurrage and detention charges and creating a bullwhip effect for inland transportation planning. It is precisely this kind of performance data that shippers and 3PLs leverage in commercial negotiations to demand better service or compensation.
4. A Marathon Session: MSC Sets Records for Work and Dwell Time in Long Beach
The most extreme dwell time recorded for a single carrier at a specific port belongs to MSC at the Port of Long Beach. In this extreme case, with an average work time and total dwell time both clocking in at 172.0 hours, the data implies a near-zero waiting time. This suggests vessels may have berthed quickly but then became locked in an exceptionally long terminal operation. A vessel spending over a full week at the terminal has major ripple effects on the entire supply chain, impacting everything from yard and rail resource planning to chassis availability.
5. The Speed Demon: Matson Sets the Gold Standard in Ningbo
On the other end of the spectrum, the single most efficient carrier-port combination observed was Matson at the Port of Ningbo, achieving an average dwell time of just 8.4 hours. This remarkable efficiency is not an accident; it's a testament to a specialized business model. Matson is well-known for its premium, expedited services from Asia to the US West Coast, for which shippers pay a premium. This figure, more than 20 times faster than the longest dwell time recorded, serves as a powerful benchmark for what is possible in a high-priority, optimized operational environment.
Conclusion: Data-Driven Decisions in a Volatile World
November's performance data reveals a hyper-fragmented operational landscape where port and carrier choices have direct, quantifiable impacts on supply chain velocity. This level of granular data empowers shippers, 3PLs, and other logistics providers to move beyond assumptions and make smarter, evidence-based decisions for routing, carrier selection, and commercial negotiations.
As we look ahead, how will you use this kind of port-level data to build a more resilient and efficient supply chain?
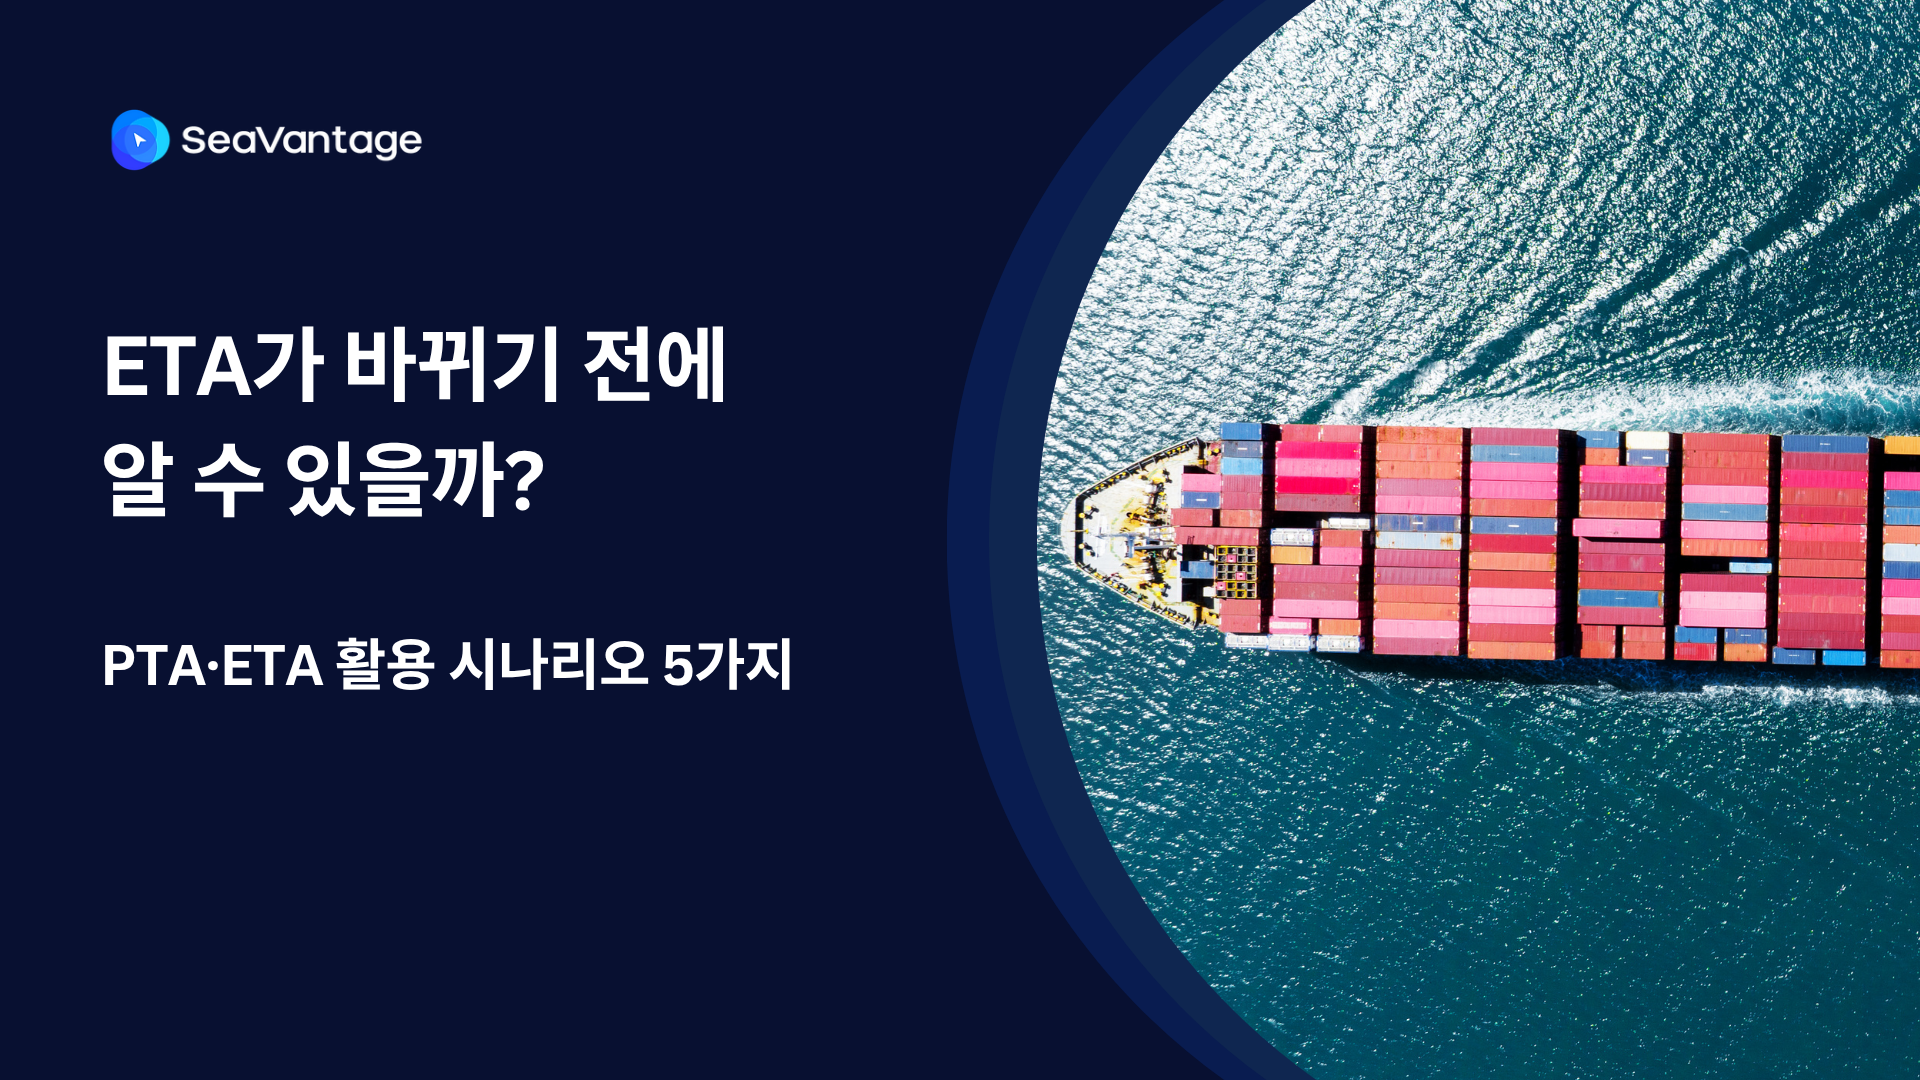
선사 ETA가 바뀌기 전에 일정 변동 가능성을 미리 파악할 수 있을까요? PTA와 ETA의 차이, 구간별 확인 방법, 실무 대응 시나리오 5가지를 소개합니다.
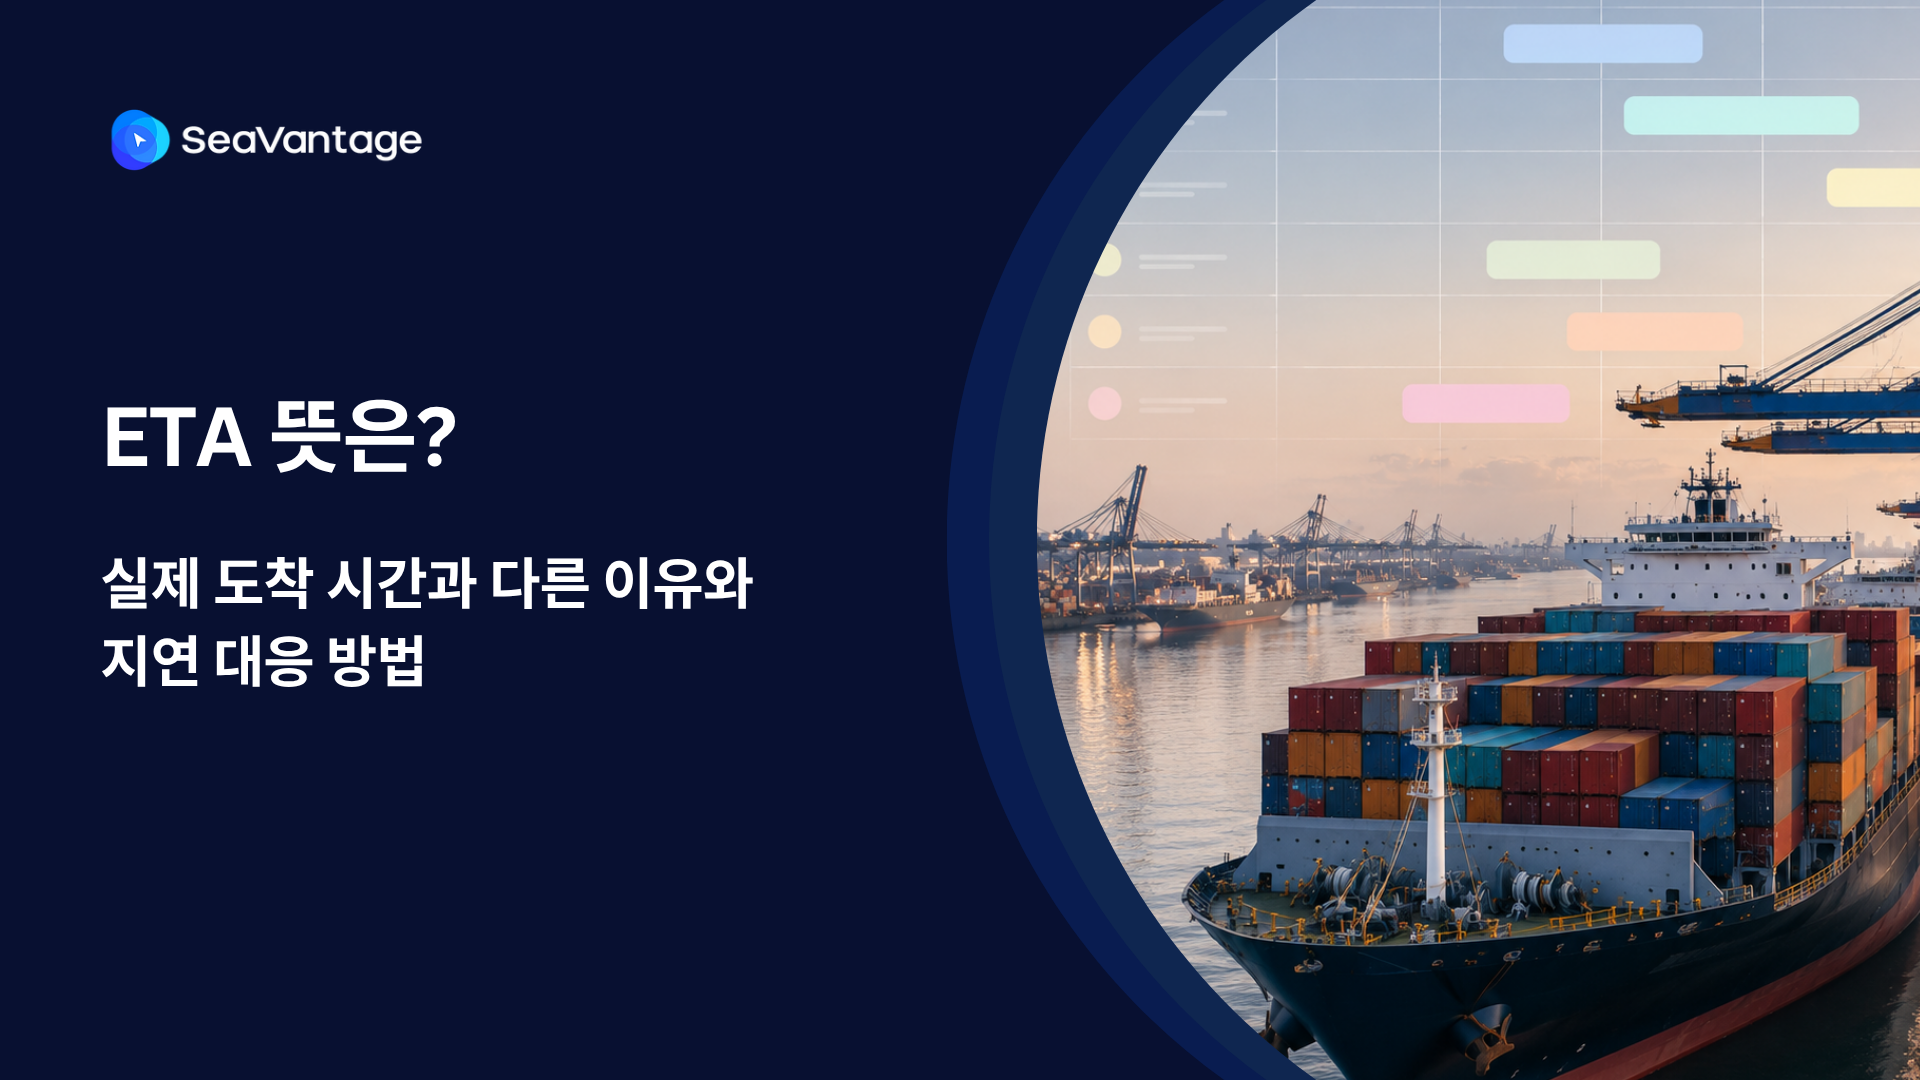
ETA(Estimated Time of Arrival) 뜻과 ETD·ATA와의 차이, ETA가 실제 도착 시간과 달라지는 이유를 알아보세요. ETA 변동에 대응하는 방법과 SeaVantage PTA 활용법도 함께 소개합니다.

호르무즈 해협 위치부터 세계 원유·LNG 공급망에서의 역할, 이란의 봉쇄 가능성, 한국에 미치는 영향까지 한눈에 정리했습니다. 최신 데이터와 사례를 바탕으로 공급망 리스크를 쉽게 이해해 보세요.

PTA is SeaVantage's predictive signal for ocean freight visibility. Learn how to read PTA alongside ETA, leg by leg, to catch delays before they happen.
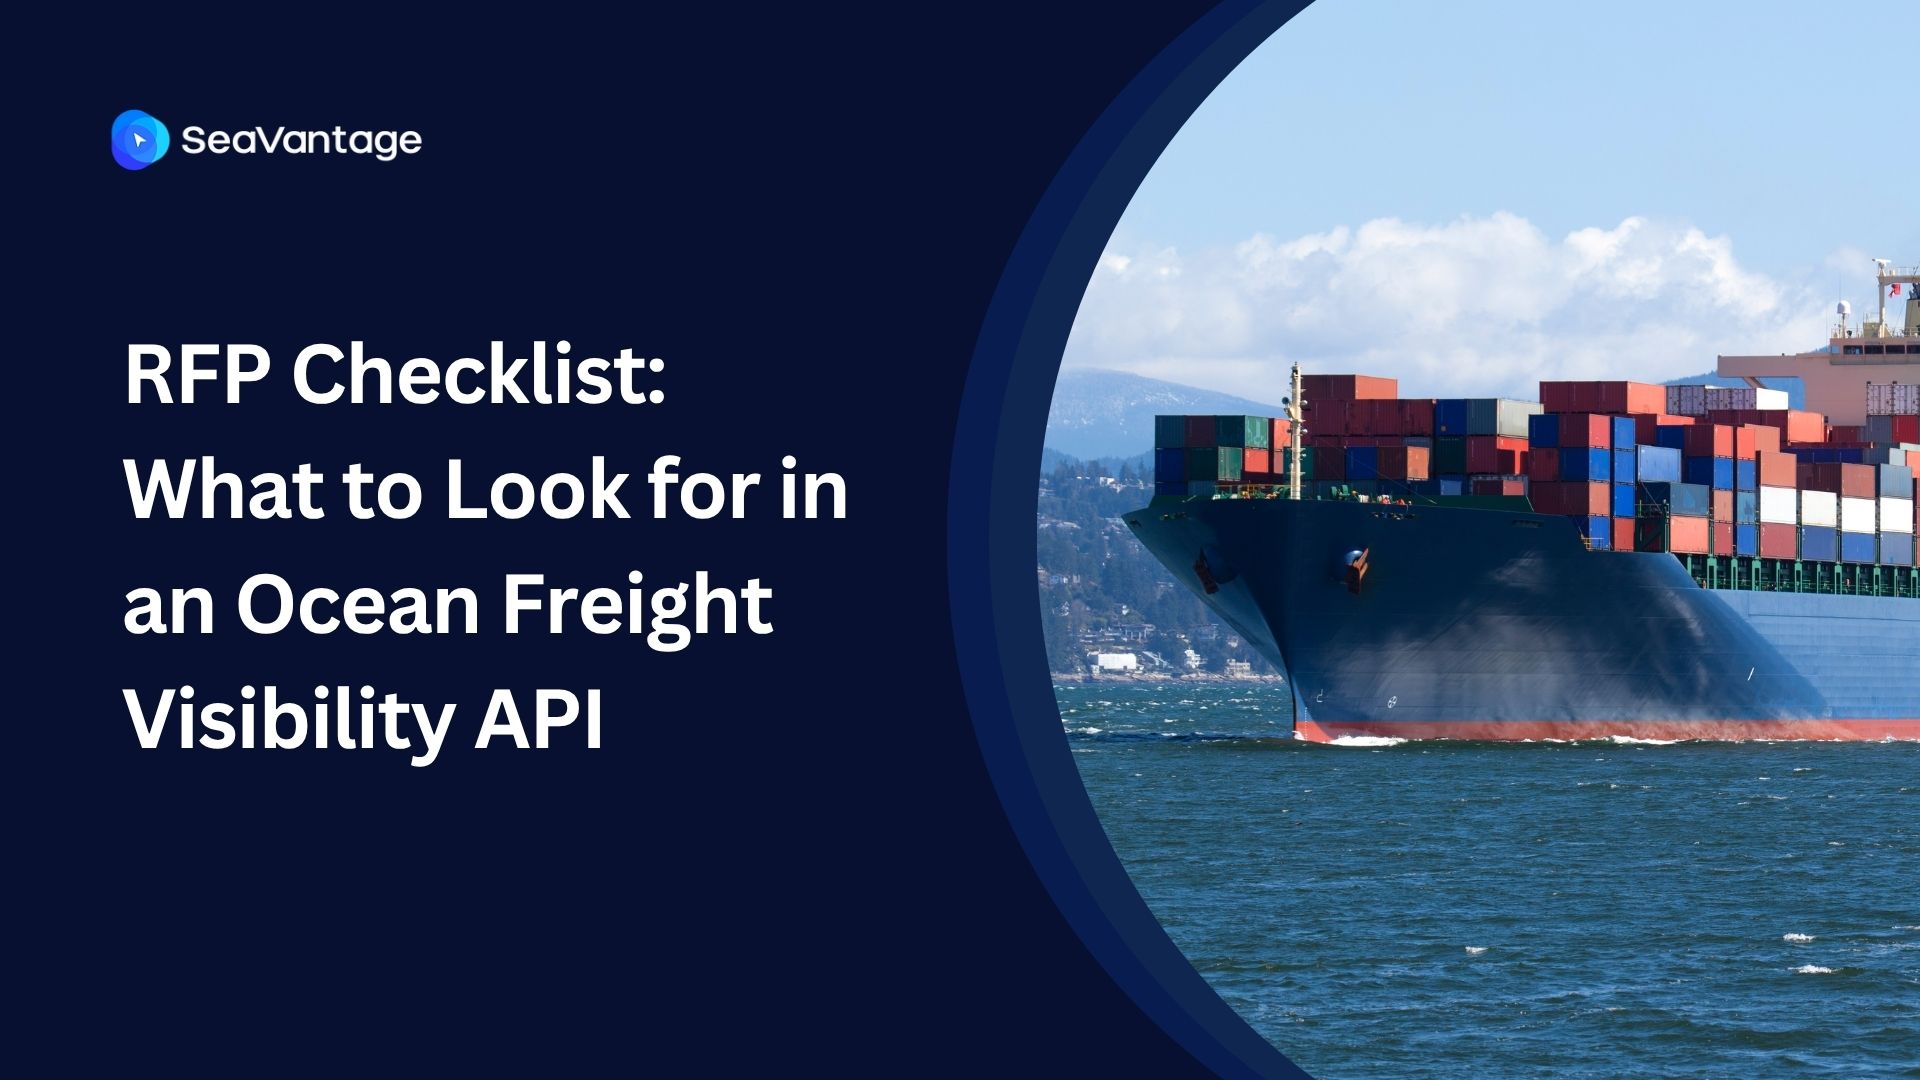
A practical RFP checklist for evaluating ocean freight and container visibility API vendors — data accuracy, integration, security, SLAs, and partnership fit.
Should your firm build, buy, or partner for container and ocean freight visibility on client engagements? A practical framework for consulting and SI firms.
.png)