


Global Ocean Shipping in 2025: Disruption, Diversification, and the New Reality of Maritime Logistics

Key Takeaways
- Global ocean trade in 2025 was reshaped by tariffs, labor unrest, and geopolitical instability, forcing rapid operational adaptation.
- Blank sailings surged across major trade lanes, exposing the fragility of schedule reliability in container shipping.
- Container volumes declined year-over-year, while sourcing diversification away from China accelerated.
- Port performance improved in some regions but remained highly vulnerable to labor actions and congestion.
- Canal traffic diverged sharply, with Panama rebounding and Suez volumes collapsing due to security risks.
- Resilience in ocean logistics is now defined by speed of response, predictive visibility, and agility, not stability.
The State of Ocean Shipping in 2025: Why This Year Matters
Ocean shipping has always reflected the health of the global economy. In 2025, it did more than reflect it, it absorbed the shock.
Tariff escalations, trade policy uncertainty, labor disruptions, and geopolitical conflict converged into one of the most volatile operating environments the maritime industry has faced in years. For carriers, ports, and shippers alike, the year tested not just capacity and cost structures, but the ability to adapt in real time.
What emerged was a clear signal: traditional planning models based on static schedules and historical averages are no longer sufficient. Ocean logistics in 2025 became a live system: reactive, interconnected, and increasingly unpredictable.
Blank Sailings Surge as Schedule Reliability Breaks Down
One of the clearest indicators of stress across global ocean networks in 2025 was the sharp increase in blank sailings.
Trade lanes connected to the United States experienced the highest volatility, particularly:
- China–Europe
- Asia–U.S. West Coast
- U.S. West Coast–China
These cancellations were not isolated incidents. They reflected deeper structural pressures:
- Oversupply from the deployment of mega ships
- Weakening consumer demand in key markets
- Escalating tariffs and retaliatory trade actions
As tariffs intensified mid-year, carriers were forced to cancel sailings to realign capacity with collapsing demand. Even as conditions stabilized later in the year, schedule reliability remained fragile; highlighting how quickly disruptions propagate through global liner networks.
For shippers and forwarders, blank sailings became a planning risk, not an exception.
Global Container Volumes Decline as Trade Patterns Shift
Despite early-year inventory front-loading, global container volumes declined meaningfully throughout 2025.
Year-to-date volumes fell in the double digits compared to the previous year, with the sharpest contraction occurring after tariff announcements took effect. The China–U.S. trade lane was hit particularly hard, experiencing a significantly steeper decline than global averages.
This was not just a demand story, it was a strategic sourcing reset.
Companies responded to sustained tariff pressure by accelerating diversification:
- Imports from Southeast Asia rose sharply
- Manufacturing dependence on China continued to unwind
- Near-term cost increases were traded for long-term supply chain resilience
On the export side, retaliatory tariffs further distorted flows. U.S. exports to China dropped substantially, impacting agricultural and commodity sectors and reinforcing the asymmetric nature of trade disruptions.
Sourcing Diversification Becomes Structural, Not Temporary
What began as a tactical response to tariffs increasingly looks like a structural shift in global sourcing.
Throughout 2025, Southeast Asian corridors showed consistent growth despite ongoing trade uncertainty. This growth signaled more than opportunistic rerouting — it reflected long-term investment decisions by manufacturers seeking geographic flexibility.
However, diversification introduced new complexity:
- Less mature port and inland infrastructure
- Increased transshipment dependency
- Higher exposure to regional weather and congestion risks
As supply chains stretched across more nodes, visibility gaps widened, making real-time insight a prerequisite rather than a nice-to-have.
Port Performance Improves — But Remains Fragile
Port operations in 2025 delivered a mixed outcome.
On the import side, several major gateways showed gradual improvement in dwell times, supported by:
- Better yard management
- Improved inland coordination
- Partial normalization of vessel arrivals
Yet this progress remained fragile.
Labor actions, infrastructure constraints, and weather events repeatedly reversed gains — particularly in export and transshipment flows. Transshipment hubs faced elevated dwell times as vessel bunching, feeder disruptions, and downstream congestion compounded delays.
The result was a system that could perform efficiently under stable conditions, but struggled under stress — reinforcing the need for dynamic port intelligence rather than static benchmarks.
Transshipment Hubs Reveal Systemic Vulnerabilities
Transshipment-dependent ports experienced the greatest volatility in 2025.
As upstream disruptions cascaded through global networks, hubs in Asia and the Mediterranean saw dwell times spike. Tight vessel synchronization requirements left little room for recovery once schedules slipped.
This volatility underscored a key reality:
In hub-and-spoke shipping models, small disruptions upstream can trigger outsized downstream delays.
For cargo owners and operators, this made contingency routing, predictive ETA accuracy, and early disruption detection critical for maintaining service reliability.
Panama and Suez: A Tale of Two Canals
Few indicators captured the divergence in global trade routes more clearly than canal traffic.
- Panama Canal traffic rebounded strongly following drought-related restrictions, supported by:
- Improved water levels
- Inventory pull-forward
- Red Sea avoidance
- Suez Canal, by contrast, saw volumes collapse as security risks in the Red Sea forced widespread rerouting.
These opposing trends reshaped global transit times, fuel costs, and capacity deployment — often with little notice.
For supply chain planners, canal risk shifted from a theoretical concern to a live operational variable.
What This Means for Ocean Supply Chain Leaders
The defining lesson of 2025 is not that disruption is inevitable — it’s that response speed now determines outcomes.
Leaders navigating ocean logistics today face a fundamentally different operating environment:
- Schedules change faster than planning cycles
- Disruptions originate across policy, labor, climate, and geopolitics
- Visibility gaps translate directly into cost and service risk
Winning organizations are no longer those with the lowest cost structures alone, but those with the fastest decision loops.
What Leaders Should Do Next
To build resilience in this new reality, maritime and supply chain leaders should prioritize:
- Predictive visibility over historical reporting
- Real-time network awareness across vessels, ports, and trade lanes
- Scenario-ready planning that accounts for policy and geopolitical shocks
- Data standardization to reduce dependency on carrier-provided schedules
Most importantly, organizations must shift from reactive execution to anticipatory decision-making.
The SeaVantage Perspective
At SeaVantage, we see 2025 as a turning point.
Ocean logistics is no longer about tracking what already happened — it’s about understanding what is likely to happen next. Predictive maritime intelligence, real-time vessel and port visibility, and data-driven decision support are becoming foundational capabilities for global supply chains operating under constant uncertainty.
As volatility becomes the norm, clarity becomes the advantage.
Looking Ahead
The ocean shipping industry proved in 2025 that it can adapt under pressure. But adaptability alone is no longer enough.
The next phase of global trade will reward organizations that invest in agility, automation, and predictive insight — not just capacity. Resilience is no longer measured by stability, but by the ability to respond faster than disruption spreads.
For maritime logistics, the future belongs to those who can see it coming.
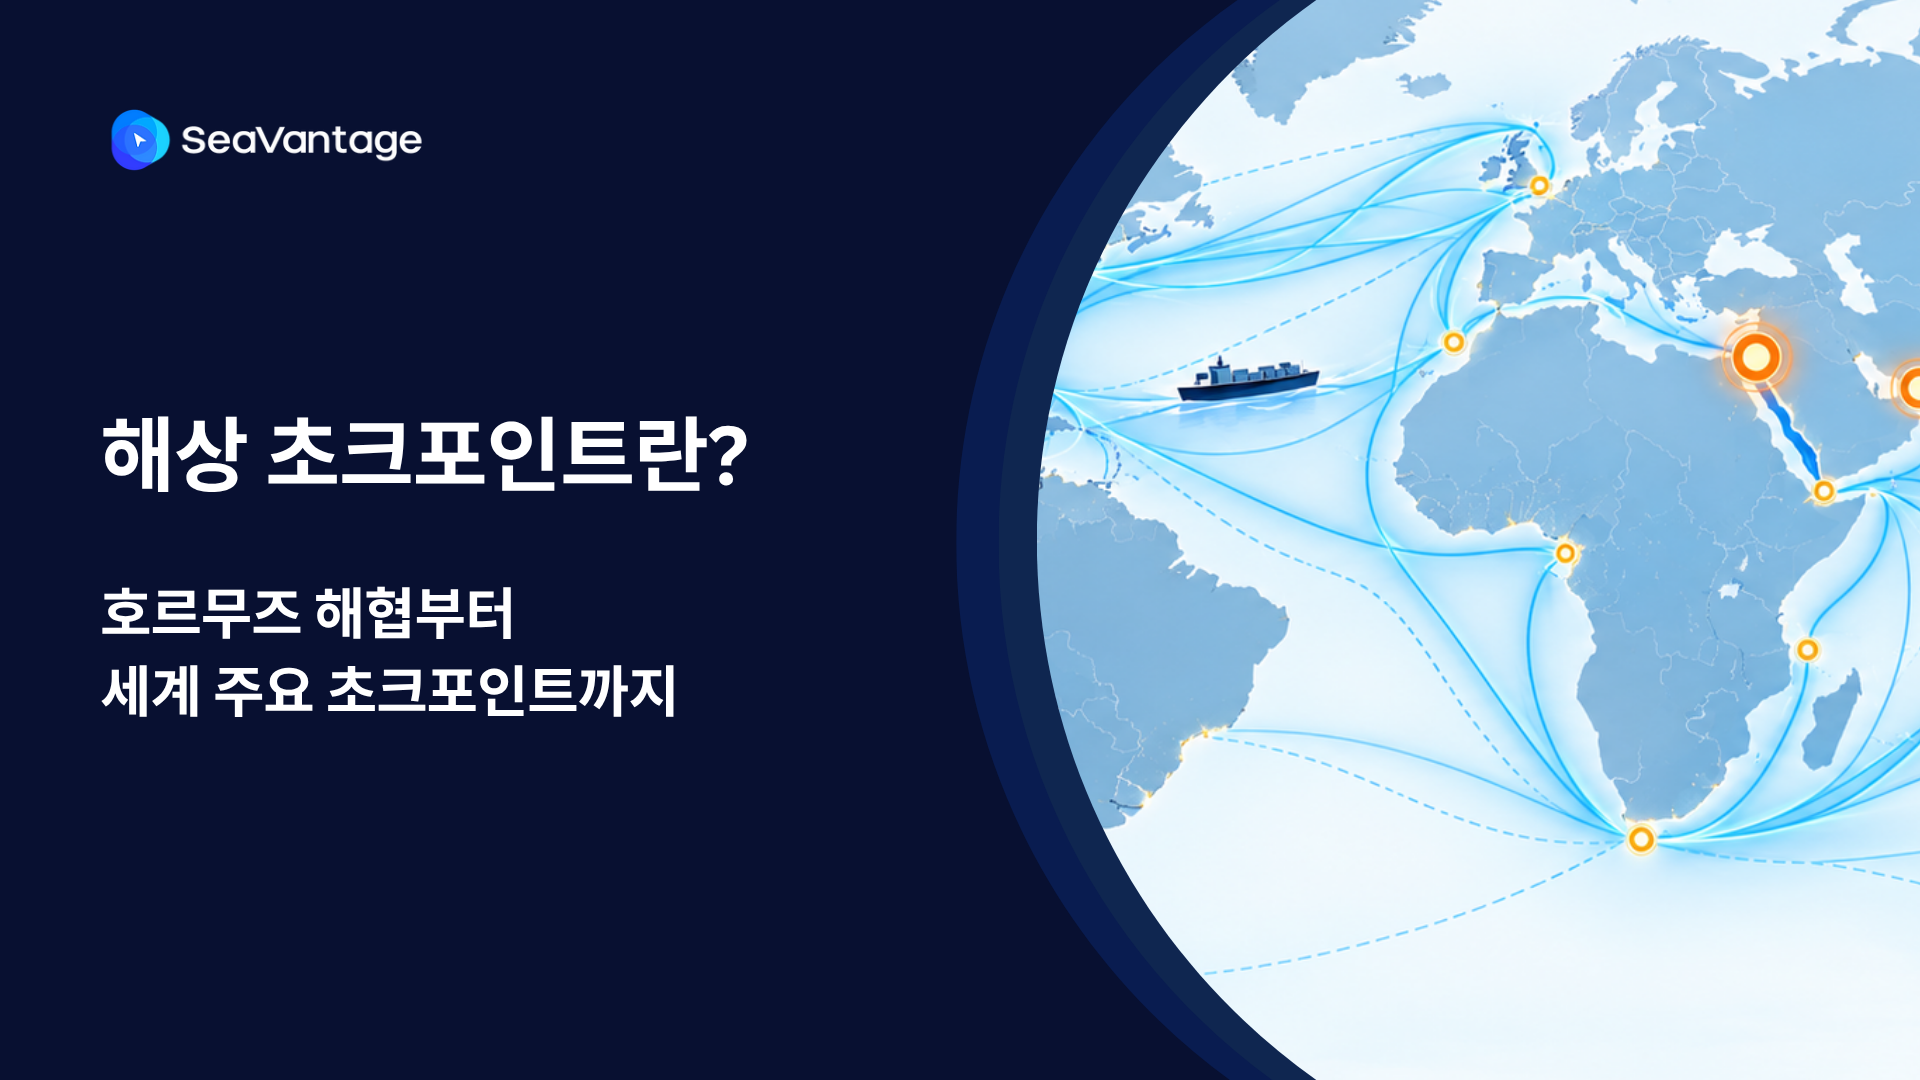

팬스타 아크로호가 지난 8월 22일 북극항로 시범운항을 시작했습니다. 국내 최초 컨테이너선 북극항로 운항 현황과 상업성 검증 항목, 화주·포워더가 주목할 사항을 정리합니다.
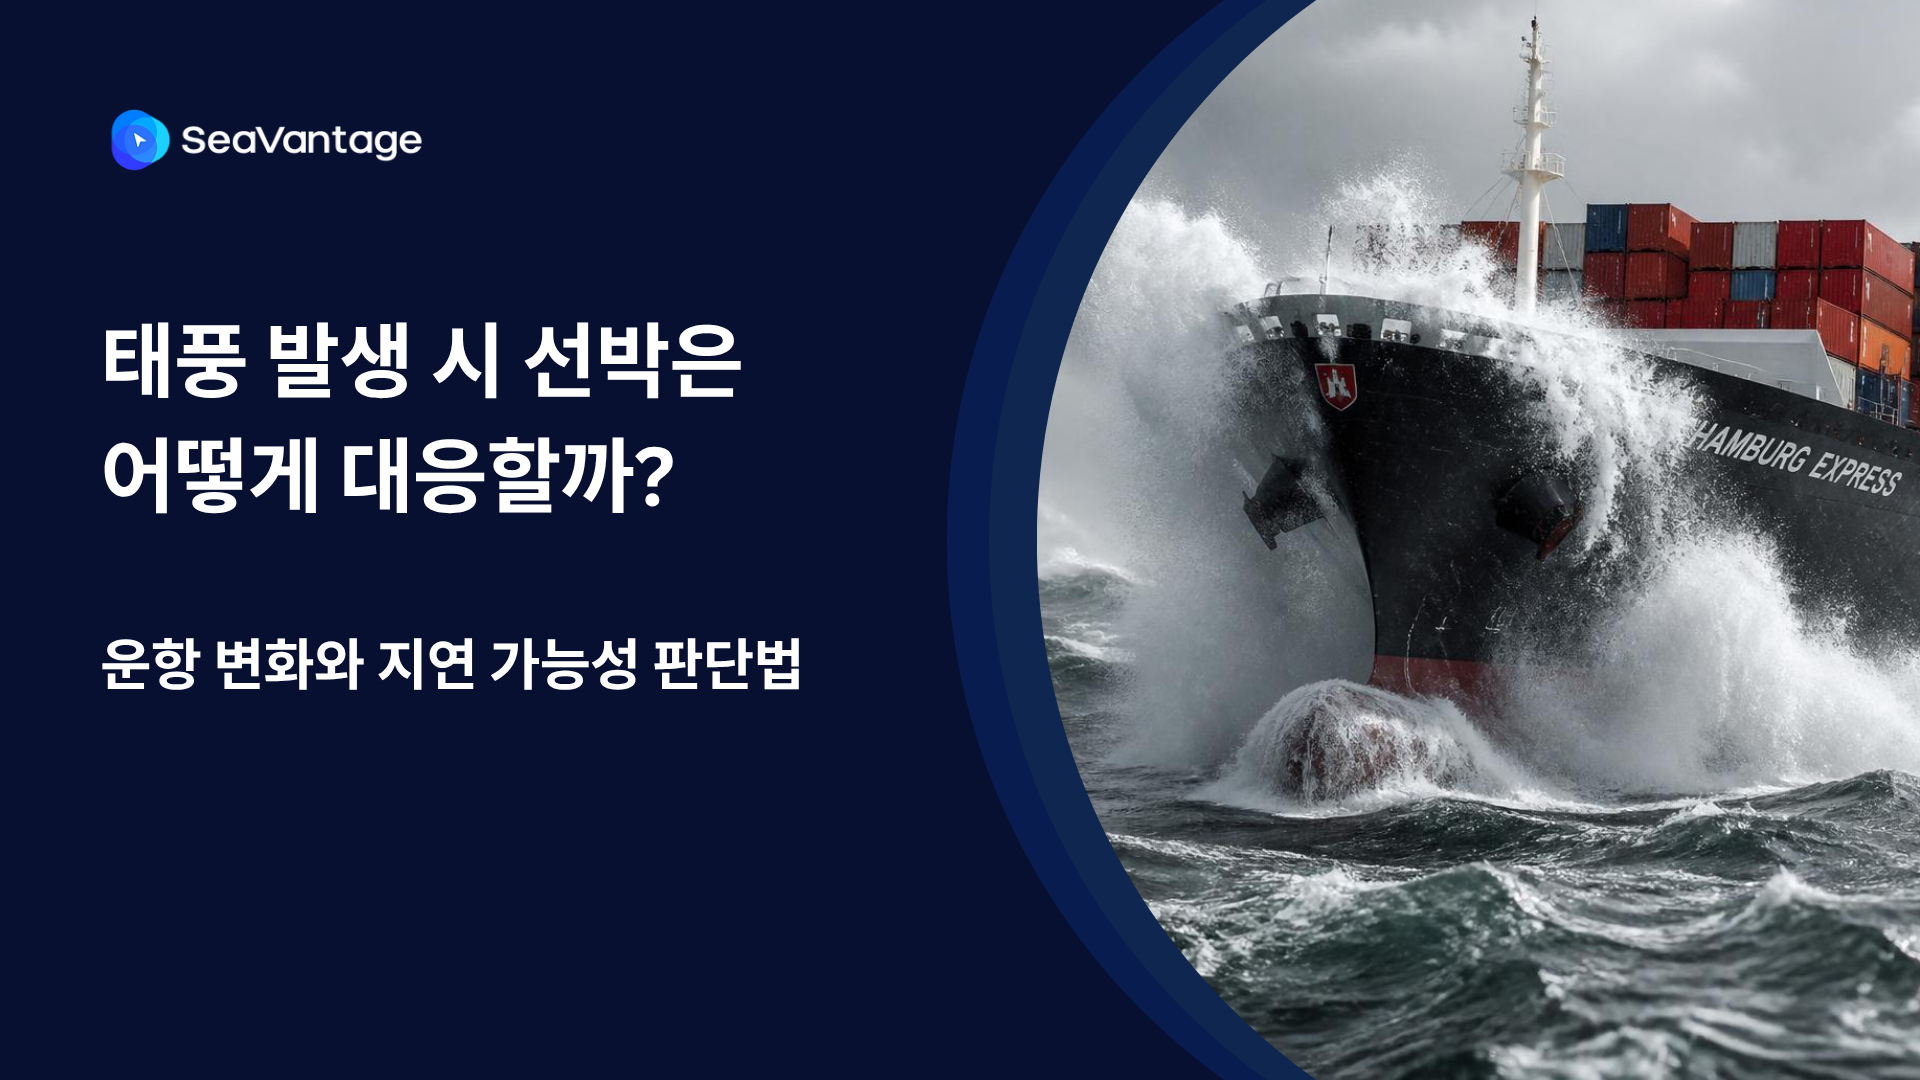
태풍 발생 시 선박은 우회·감속·대기 등 서로 다르게 대응합니다. AIS 항적과 ETA·PTA·PTB, 항만 혼잡 데이터를 활용해 해상운송 지연 가능성을 판단하는 방법을 알아보세요.
Need a SeaRates alternative? See how SeaVantage Cargo Insight supports container tracking, predicted arrivals, shipment milestones, and API access.
TPEB rates 2026, Indian Subcontinent ocean freight capacity, Strait of Hormuz shipping disruption, schedule reliability ocean carriers
What's driving ocean freight peak season 2026 — rates, surcharges, booking windows, and how to avoid missed inventory deadlines.

.png)


