
Strait of Hormuz Live Shipping Data: Tanker Traffic, Heatmap Analysis & Maritime Supply Chain Risk
Strait of Hormuz:
The World's Most
Critical Chokepoint
Real-time vessel tracking, heatmap analysis, and supply chain risk intelligence for the waterway that moves one-fifth of the world's oil.
- One-fifth of global oil supply transits the Strait of Hormuz daily — making it the single most critical maritime chokepoint on Earth, with no viable bypass alternative.
- 1,265 vessels are currently active across the corridor, dominated by 594 tankers (47% of all traffic), with bulk carriers, cargo ships, and gas tankers making up the rest.
- The heatmap tells the real story — traffic density peaks at the Strait's exit into the Gulf of Oman, around Fujairah's bunkering hub, and near the world's largest oil loading terminals at Ras Tanura and Kharg Island.
- Vessel movements are market signals — tanker queuing, speed anomalies, and AIS blackouts near Iranian waters are leading indicators of supply disruption, often visible hours before price moves.
- AIS data in this region is actively contested — GPS spoofing and signal manipulation are documented tactics, making raw tracking data unreliable exactly when it matters most.
- SeaVantage filters the noise — with AIS signal filtering, maritime traffic network analysis, and predictive ETA intelligence, updated every 15 minutes across the Persian Gulf and Omani waters.
Why the Strait of Hormuz Matters
At its narrowest point, the Strait of Hormuz measures just 21 nautical miles wide — yet this sliver of water between Iran and Oman is the single most consequential maritime chokepoint on Earth. Roughly one-fifth of the world's total oil supply and significant volumes of liquefied natural gas transit these waters daily, connecting the energy-rich Gulf states to markets across Asia, Europe, and beyond.
There is no viable alternative. The bypass pipelines that exist — the East-West Pipeline through Saudi Arabia and the Abu Dhabi Crude Oil Pipeline — can offset only a fraction of Hormuz capacity. For the global energy market, this strait is effectively irreplaceable.
The Strait is also a geopolitical flashpoint. Tensions between Iran and Western-aligned nations, regional conflicts, and maritime security incidents have repeatedly threatened — and periodically disrupted — shipping through this corridor, sending energy price shockwaves across global markets.
For commodity traders, insurers, tanker operators, and energy-dependent manufacturers, understanding what is moving through the Strait — in real time — is not a luxury. It is a fundamental risk management requirement.
Current Vessel Activity: What the Data Shows
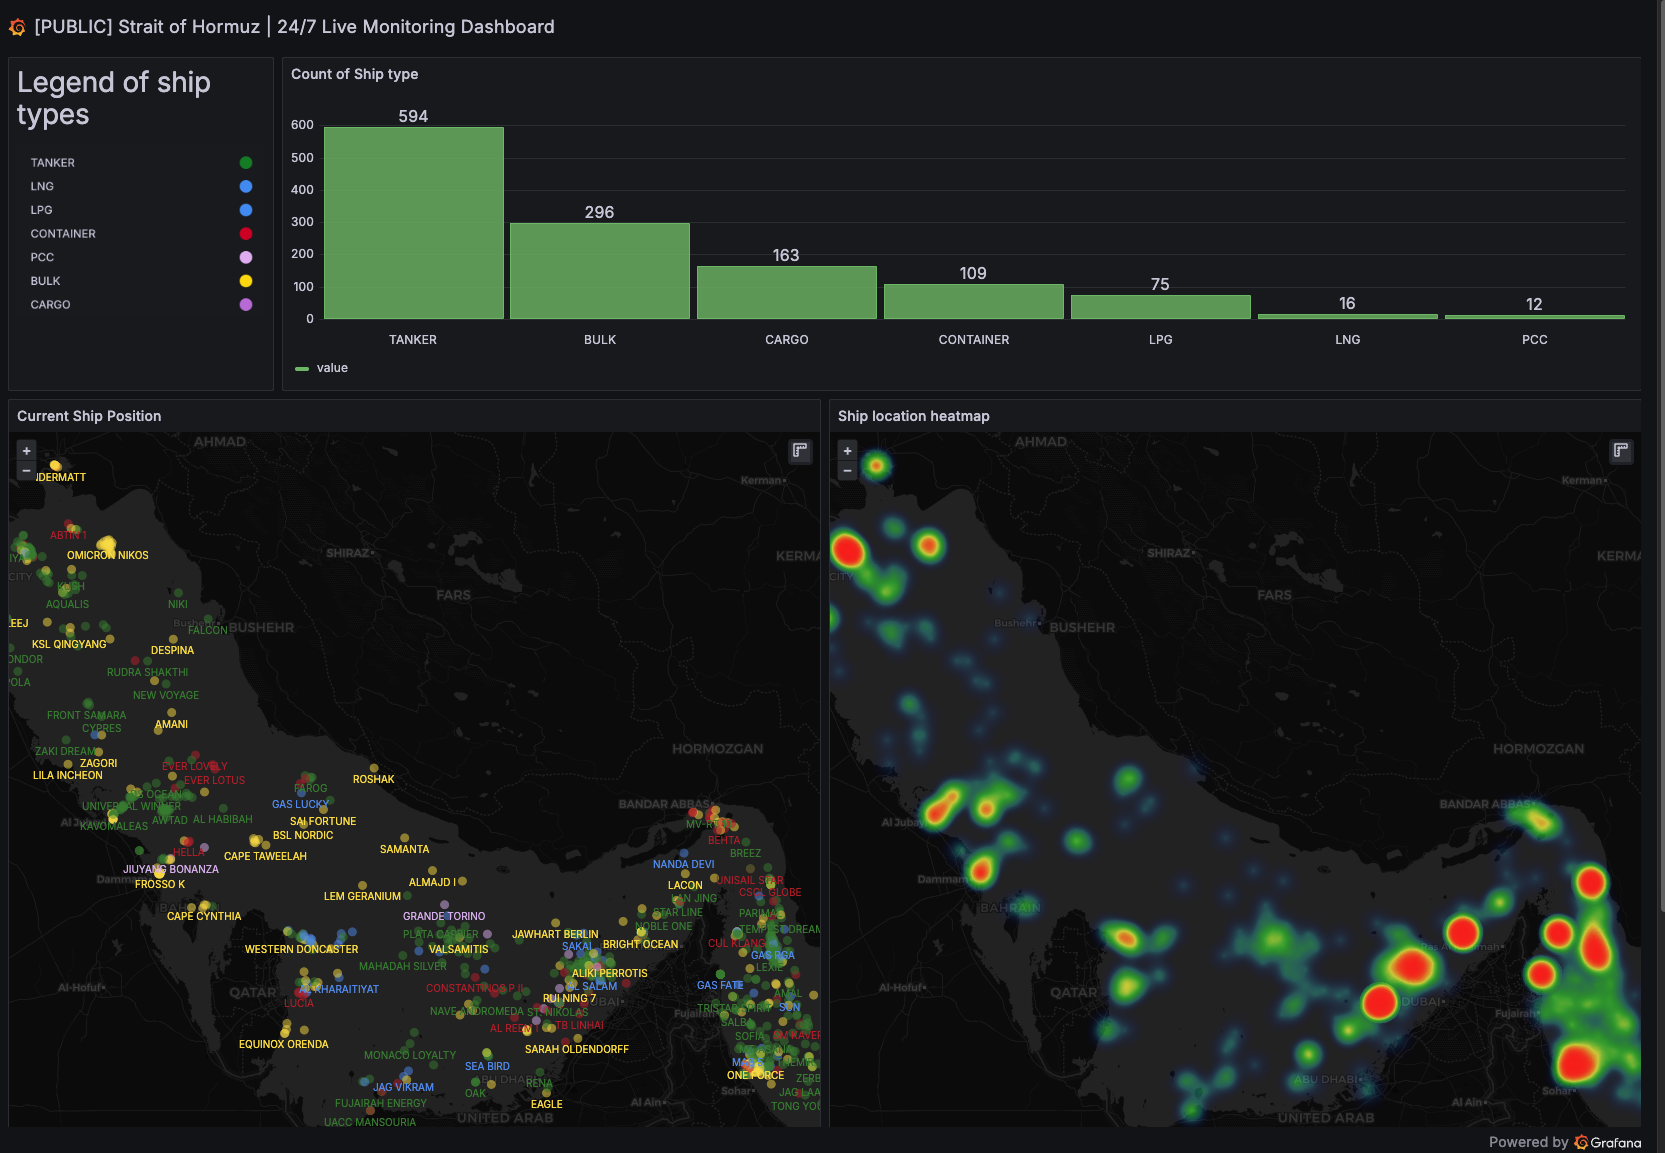
SeaVantage's live monitoring dashboard, updated every 15 minutes across the inner Persian Gulf and the Omani waters approaching the Strait, currently tracks 1,265 vessels across seven ship categories.
| Vessel Type | Count | Share | |
|---|---|---|---|
| Tanker | 594 | 47% | |
| Bulk | 296 | 23% | |
| Cargo | 163 | 13% | |
| Container | 109 | 9% | |
| LPG | 75 | 6% | |
| LNG | 16 | 1% | |
| PCC | 12 | 1% |
The dominance of tankers — nearly half of all tracked vessels — underscores the Strait's singular role as an oil export highway. Bulk carriers account for nearly a quarter of traffic. The presence of 75 LPG vessels and 16 LNG tankers reflects the region's growing role as a gas exporter, particularly to Asian markets.
Heatmap Analysis: Where Risk Concentrates
The ship location heatmap reveals something raw vessel counts cannot: where exactly traffic density spikes, and therefore where disruption risk is highest.
The Strait's exit into the Gulf of Oman — shown in deep red — is the highest-concentration corridor and the most militarily exposed stretch of the route.
Hotspots cluster around Fujairah reflecting massive bunkering activity, ship-to-ship transfers, and anchorage staging areas for the Strait transit.
Elevated activity around Ras Tanura and Kharg Island — the world's largest oil export terminals — with vessels loading and staging for southbound transit.
Once through the Strait, vessels fan out rapidly into Indian Ocean lanes heading to Asia, Europe, and beyond.
A sudden change in heatmap density — vessels clustering near anchorage zones, unexpected slowdowns, or a thinning of the inbound lane — can signal emerging disruption hours before it shows up in price data or news headlines.
Tanker Concentration and Energy Market Signals
The 594 tankers currently tracked in Hormuz waters represent a substantial fraction of the global VLCC and Aframax fleet. Their movements are not just logistics data — they are leading indicators for global oil supply.
"When tanker bunching accelerates near Kharg Island without a corresponding outbound surge through the Strait, traders should pay attention — something upstream has changed."
SeaVantage Maritime IntelligenceTanker queuing near loading terminals — an increase in vessels at anchor off Ras Tanura or Kharg Island often precedes a production surge or sanctions-related delay. Speed anomalies — tankers loitering or changing course unexpectedly can indicate cargo destination changes, interdiction events, or evasive routing. Dark ship activity — vessels going AIS-silent is itself a signal tracked through SeaVantage's corrupted signal detection layer.
For LNG and LPG markets specifically, the 91 gas carrier vessels tracked through Hormuz represent critical supply to Asian buyers on long-term contracts — any sustained disruption creates immediate spot price volatility in Tokyo, Seoul, and Shanghai.
Why Real-Time AIS Monitoring Matters for Supply Chains
The Strait of Hormuz is one of the world's most AIS-contested environments. Iran has a documented history of GPS spoofing and AIS signal manipulation. During heightened tension periods, vessel tracking data becomes fragmented, falsified, or goes dark entirely — exactly when reliable intelligence is most needed.
At SeaVantage, we focus on solving this challenge through maritime data intelligence. By filtering corrupted AIS signals and analyzing vessel behavior patterns, our platform helps reconstruct likely vessel movements even when signals are incomplete.
Detect and remove manipulated or corrupted AIS signals in real time. Our models distinguish legitimate position gaps from deliberate spoofing, giving analysts clean, trustworthy data even in contested environments.
Validate vessel routes against historical maritime traffic patterns. Anomalous deviations from established lanes are flagged automatically, providing early warning of irregular vessel behavior.
Improve arrival time predictions even when AIS signals are incomplete or disrupted. Supply chain teams get reliable ETAs for cargo planning — even when vessels go partially dark through the Strait.
When AIS goes dark, SeaVantage helps improve maritime visibility even when traditional tracking systems become unreliable. For port operators, commodity trading desks, insurance underwriters, and logistics teams with exposure to Gulf energy flows, this capability is the difference between proactive response and reactive scramble.
Our dashboard covers the full corridor — inner Persian Gulf loading zones to Omani waters at the Strait's mouth — updated every 15 minutes, so operators see disruptions forming in real time, not in retrospect.
Monitor Global Shipping Risks
with SeaVantage Real-Time Data
Join energy traders, logistics teams, and risk analysts who rely on SeaVantage to stay ahead of maritime disruption — before it moves markets.
View Live Dashboard
선사 ETA가 바뀌기 전에 일정 변동 가능성을 미리 파악할 수 있을까요? PTA와 ETA의 차이, 구간별 확인 방법, 실무 대응 시나리오 5가지를 소개합니다.
ETA(Estimated Time of Arrival) 뜻과 ETD·ATA와의 차이, ETA가 실제 도착 시간과 달라지는 이유를 알아보세요. ETA 변동에 대응하는 방법과 SeaVantage PTA 활용법도 함께 소개합니다.

호르무즈 해협 위치부터 세계 원유·LNG 공급망에서의 역할, 이란의 봉쇄 가능성, 한국에 미치는 영향까지 한눈에 정리했습니다. 최신 데이터와 사례를 바탕으로 공급망 리스크를 쉽게 이해해 보세요.

PTA is SeaVantage's predictive signal for ocean freight visibility. Learn how to read PTA alongside ETA, leg by leg, to catch delays before they happen.
A practical RFP checklist for evaluating ocean freight and container visibility API vendors — data accuracy, integration, security, SLAs, and partnership fit.
Should your firm build, buy, or partner for container and ocean freight visibility on client engagements? A practical framework for consulting and SI firms.
.png)