


April 2026 Ocean Freight: Rates, Disruption & What's Next
.jpg)
Summary
Ocean freight markets in April 2026 are being shaped by three forces: the Iran conflict disrupting Middle East shipping lanes, surging bunker fuel costs passed on as emergency surcharges, and surprisingly resilient transpacific capacity. Spot rates from Asia to the U.S. West Coast have climbed roughly 40% since late February, driven more by market sentiment and fuel cost pressure than genuine demand. Carriers are managing blank sailings carefully. Transpacific schedule reliability sits in the 57–88% range depending on carrier and gateway. Shippers should expect elevated total landed costs, continued surcharge layering, and a volatile Q2.
Ocean Freight Market Update: April 2026
The global ocean freight market entered Q2 2026 in a state of controlled tension. Rates are rising — not because cargo volumes are booming, but because a convergence of geopolitical disruption, fuel volatility, and carrier cost management is rewriting the economics of every major trade lane. For shippers trying to lock in cost certainty or navigate a congested carrier landscape, the picture is complex. This update breaks it down.
What's Driving the Ocean Freight Market in April 2026?
The Iran Conflict: The Central Shock to Global Shipping
The U.S.-Israel military operation against Iran, which began on February 28, 2026, set off a chain of events that continues to reverberate across global trade. Despite a ceasefire announced on April 7, the operational disruption to shipping has not resolved. Major carriers have publicly stated they will not resume Persian Gulf transits until safe conditions are verified — and the data reflects this standoff.
Approximately 130 container ships and dozens of tankers remain either stranded inside the Persian Gulf or anchored outside the Gulf of Oman. The Strait of Hormuz, one of the world's most critical maritime chokepoints, effectively remains closed for commercial shipping purposes. The U.S. doubled its maritime reinsurance guarantee to $40 billion on April 6, but the absence of naval escorts has kept most vessel owners on the sidelines.
The most direct consequence for containerised cargo is the collapse of feedering services into Jebel Ali (Dubai) — the largest transshipment hub in the Middle East. Cargo destined for the region is now being discharged in Oman or Saudi Arabia and moved overland via a growing trucking network dubbed the "Land Bridge." This workaround adds cost, time, and uncertainty to supply chains that previously relied on seamless Gulf connectivity.

Transpacific Eastbound (TPEB) Ocean Rates: Up 40% Since Late February
Perhaps the most counterintuitive development of April 2026 is that the sharpest rate increases are occurring on trade lanes that don't even transit the Middle East.
According to Xeneta's Chief Analyst Peter Sand, transpacific spot rates from Far East to the U.S. West Coast have surged more than 40% since the end of February — despite no spectacular shift in offered capacity or blank sailings on that specific corridor. The Freightos Baltic Index confirms Asia-to-U.S. West Coast rates reached approximately $2,420/FEU in the first week of April, up 11% week-over-week. Asia-to-U.S. East Coast rates followed at roughly $3,350/FEU.
Sand's assessment: the explanation lies significantly in market sentiment. The Middle East conflict has created a pervasive sense of unease among shippers globally, which is translating into precautionary bookings and softened capacity negotiating power — even on lanes that are operationally stable.
What Is Driving TPEB Rate Increases?
Two primary forces are at work beyond sentiment:
Emergency fuel surcharges: Bunker fuel prices spiked dramatically in March, with the global VLSFO (Very Low Sulphur Fuel Oil) average rising from around $430/mt in January to a peak near $960/mt in mid-March — more than doubling in under eight weeks. Although prices have partially corrected into early April, carriers are now passing accumulated costs forward. Flexport's data confirms that emergency fuel surcharges or bunker adjustment factors hit most non-U.S. trades in March, with U.S. trade lane implementation rolling in April.
Blank sailings and capacity management: According to Magellan Logistics' April market update, 43 blank sailings have been announced across weeks 13 to 17 — a 6% cancellation rate — concentrated heavily on Transpacific Eastbound (58%) and Asia-Europe routes (28%). Carriers are deliberately tightening available space to defend rate levels as they enter 2026–2027 service contract negotiations.
Carrier Schedule Reliability: Hapag-Lloyd Leads, but Most Trend Down
Carrier on-time performance remains a persistent operational challenge. Sea-Intelligence's latest reliability league table for April 2026 shows:
- Hapag-Lloyd leads globally at 67.4% reliability, with a particularly strong 88.1% on the Transpacific West Coast corridor — though the trend is down month-over-month.
- PIL and Evergreen are the only carriers showing upward reliability trends, at 66.4% and 65.3% respectively.
- The majority of the top 10 carriers are trending downward, reflecting network strain from fuel-driven blank sailings and displaced services previously routed through the Persian Gulf.
- ZIM fell out of the global top 10 entirely, severely impacted by Suez Canal diversions affecting North America East Coast schedules.
- Niche transpacific carrier Matson continued to outperform on their flagship CLX service, maintaining 100% on-time performance.
The industry-wide schedule reliability picture is still far from the pre-pandemic baseline. Shippers should build buffer inventory and avoid assuming schedule averages represent their actual cargo experience.
Global Ocean Rate Trends: The "Cost-Driven" Market
The SCFI (Shanghai Containerized Freight Index) data paints a clear picture: rates across all four major corridors — West Coast, East Coast, Europe, and South America — have been on an upward trajectory since March 1. However, the important nuance is that this is a cost-managed market, not a demand-driven one.
Transpacific container rates to the U.S. West Coast have climbed roughly 40% since just before the war to more than $2,400/FEU, with Asia–North Europe rates up approximately 20% to $2,900/FEU — yet underlying demand remains soft. Base freight rates remain relatively steady, with total transportation costs continuing to increase primarily as surcharges are applied more frequently.
The implication for shippers: the rate on your booking confirmation is increasingly only part of the story. Bunker adjustment factors, war risk surcharges, and emergency fuel levies are stacking on top of base rates in ways that can materially alter landed cost. Freight budget reviews are urgently needed for any shipper who set 2026 cost assumptions in late 2025.
What to Expect for the Rest of Q2 2026
Any hope of a return to normal Suez Canal transits has faded. The impact is substantial: freight costs up 20–50%, fuel consumption up around 40% for Cape diversions, and transit times extended by one to two weeks. Even when conditions eventually improve, vessel reshuffling and network repositioning will extend disruption well into H2.
For ocean freight specifically, the key watchpoints for the remainder of Q2 are:
Contract negotiation season: 2026–2027 service contracts are being negotiated now. Carriers are motivated to hold rates firm through this window. Shippers with high volumes should engage their freight partners proactively, as spot market exposure in Q2 carries significant volatility risk.
Blank sailing trajectory: The 6% sailing cancellation rate is manageable but bears close monitoring. Any escalation in blanking — particularly on PSW or USEC services — could tighten already-high utilisation further.
Fuel price stabilisation: If VLSFO prices continue to retrace from their March peak, some surcharge rollback is possible in May. But with Thailand banning Jet A-1 exports and Middle East refining disrupted, the fuel market remains fragile.
Gulf reopening timeline: A genuine normalisation of Hormuz transits would unlock significant trapped capacity. Every month of continued closure adds structural damage to Middle East-dependent supply chains, and the cumulative effect on global vessel positioning is growing.
The SeaVantage Perspective
The current ocean freight environment rewards preparation over reaction. Shippers with real-time rate benchmarking, live port congestion visibility, and accurate carrier performance data are making better decisions faster. Those relying on lagging market data are absorbing costs that could be anticipated and managed.
Key Takeaways for Shippers: April 2026
- Transpacific spot rates are up ~40% since late February, driven by fuel surcharges and market sentiment — not demand.
- The Persian Gulf effectively remains closed to commercial container shipping; expect Middle East cargo disruptions to persist through Q2.
- Savannah and major European ports are congested; U.S. West Coast gateways remain fluid.
- Carrier schedule reliability is trending down for most major lines — build transit buffer into critical shipments.
- Total cost (base rate + all surcharges) has increased significantly; 2026 freight budgets set pre-conflict need immediate review.
- The 2026–2027 contract season is active — now is the time to engage freight partners on forward rate strategy.
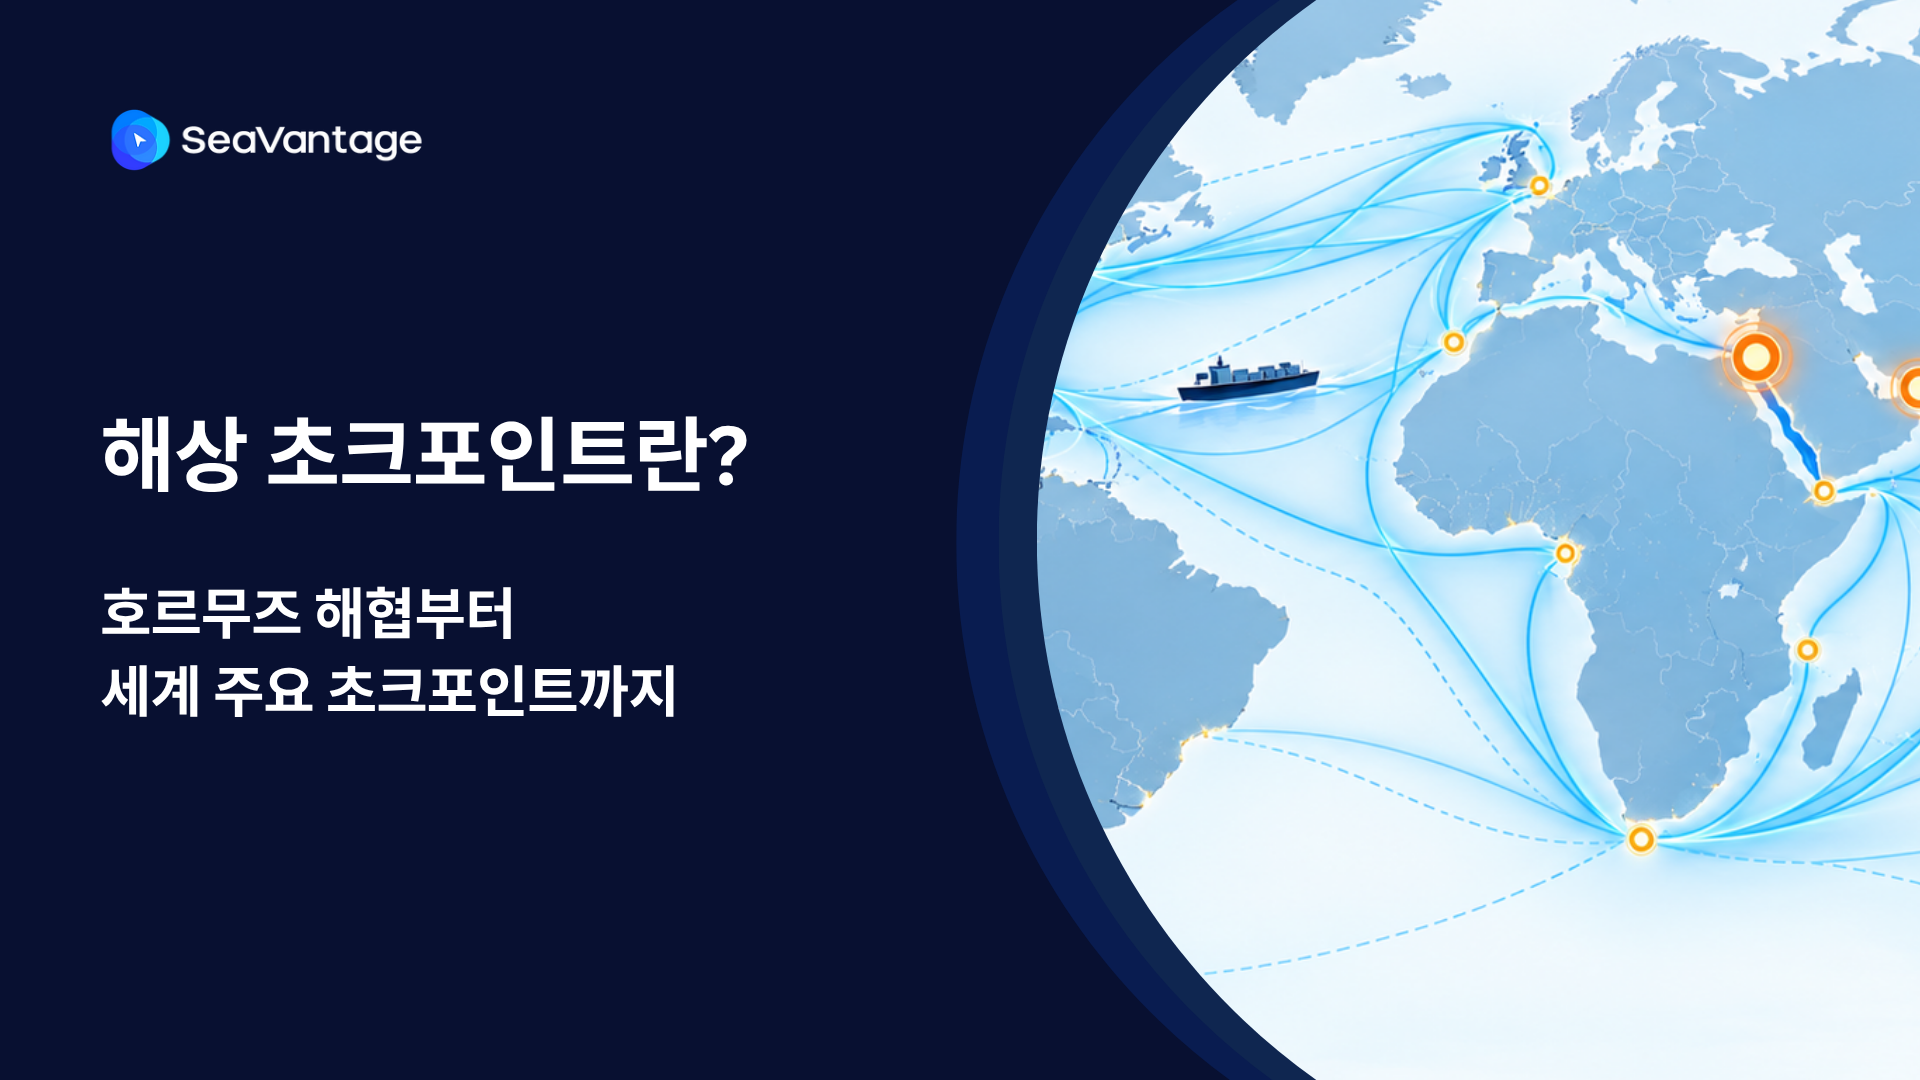

팬스타 아크로호가 지난 8월 22일 북극항로 시범운항을 시작했습니다. 국내 최초 컨테이너선 북극항로 운항 현황과 상업성 검증 항목, 화주·포워더가 주목할 사항을 정리합니다.
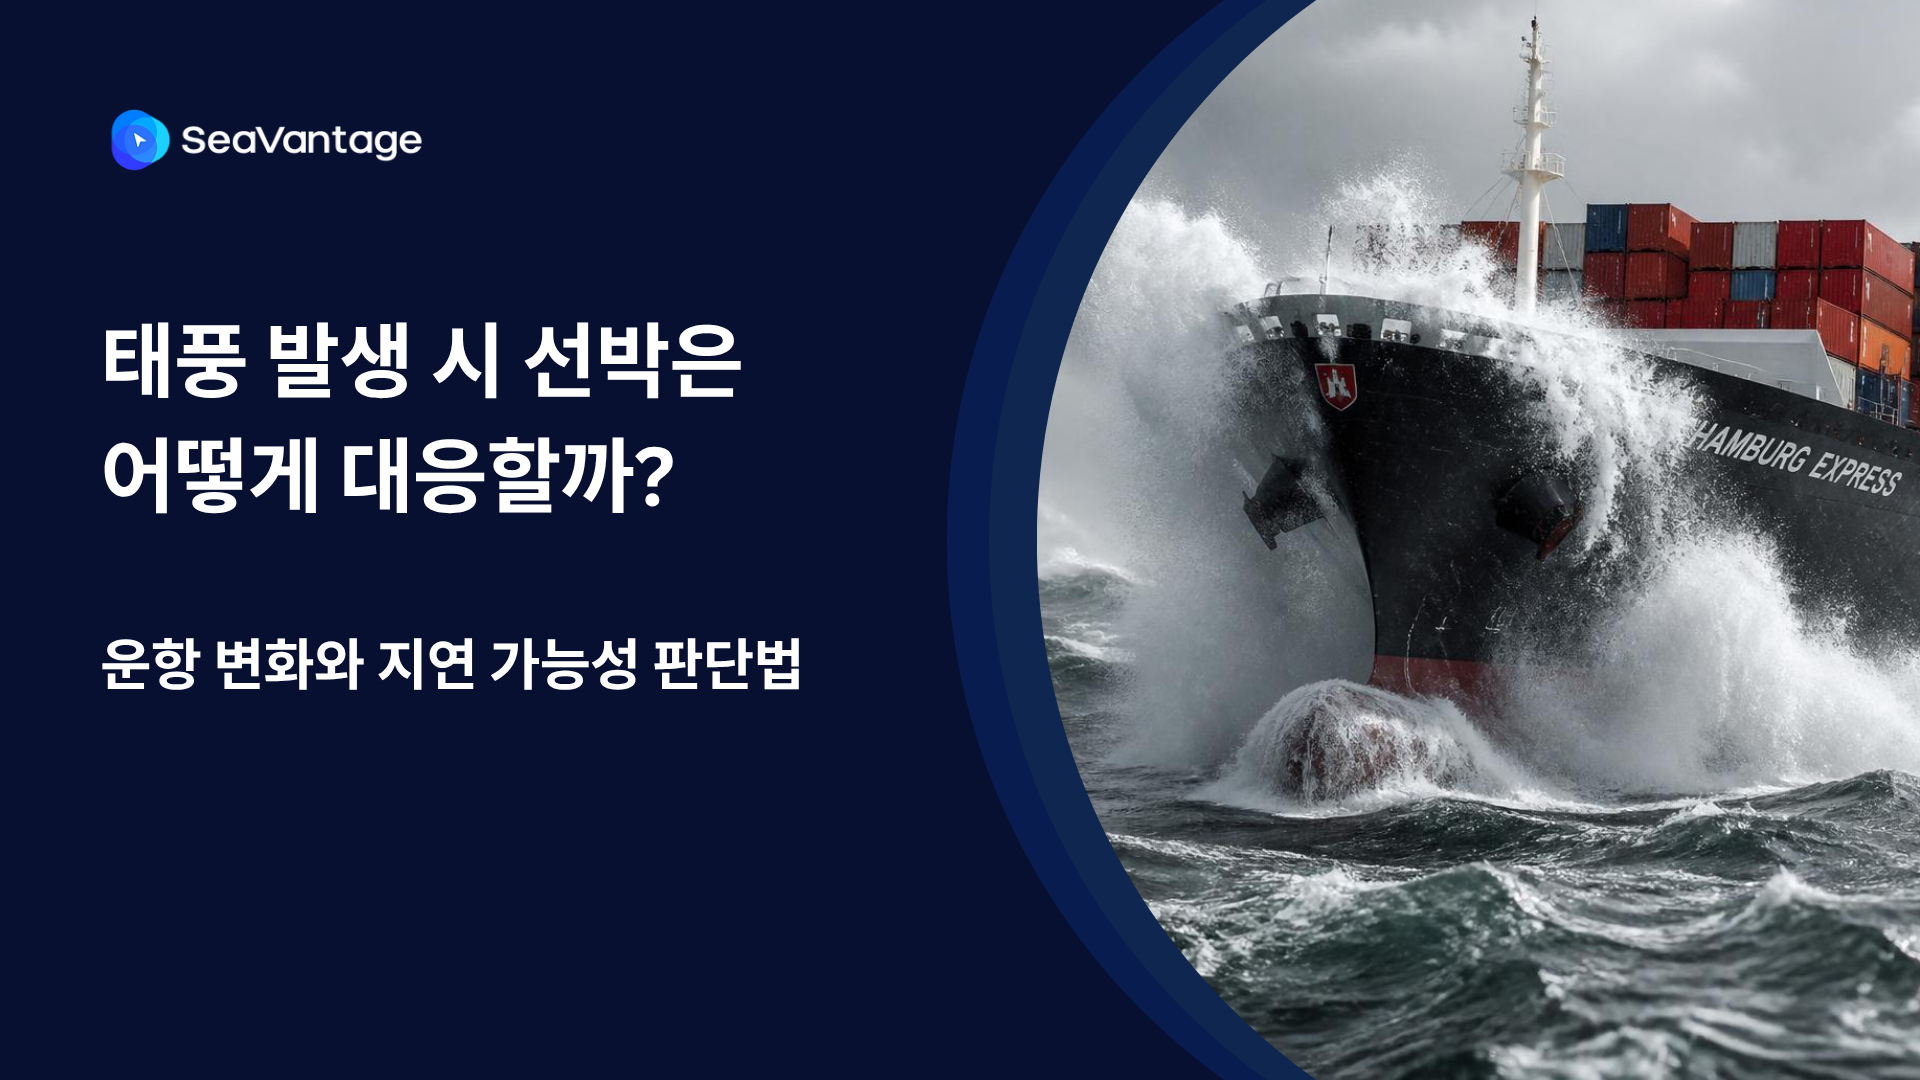
태풍 발생 시 선박은 우회·감속·대기 등 서로 다르게 대응합니다. AIS 항적과 ETA·PTA·PTB, 항만 혼잡 데이터를 활용해 해상운송 지연 가능성을 판단하는 방법을 알아보세요.
Need a SeaRates alternative? See how SeaVantage Cargo Insight supports container tracking, predicted arrivals, shipment milestones, and API access.
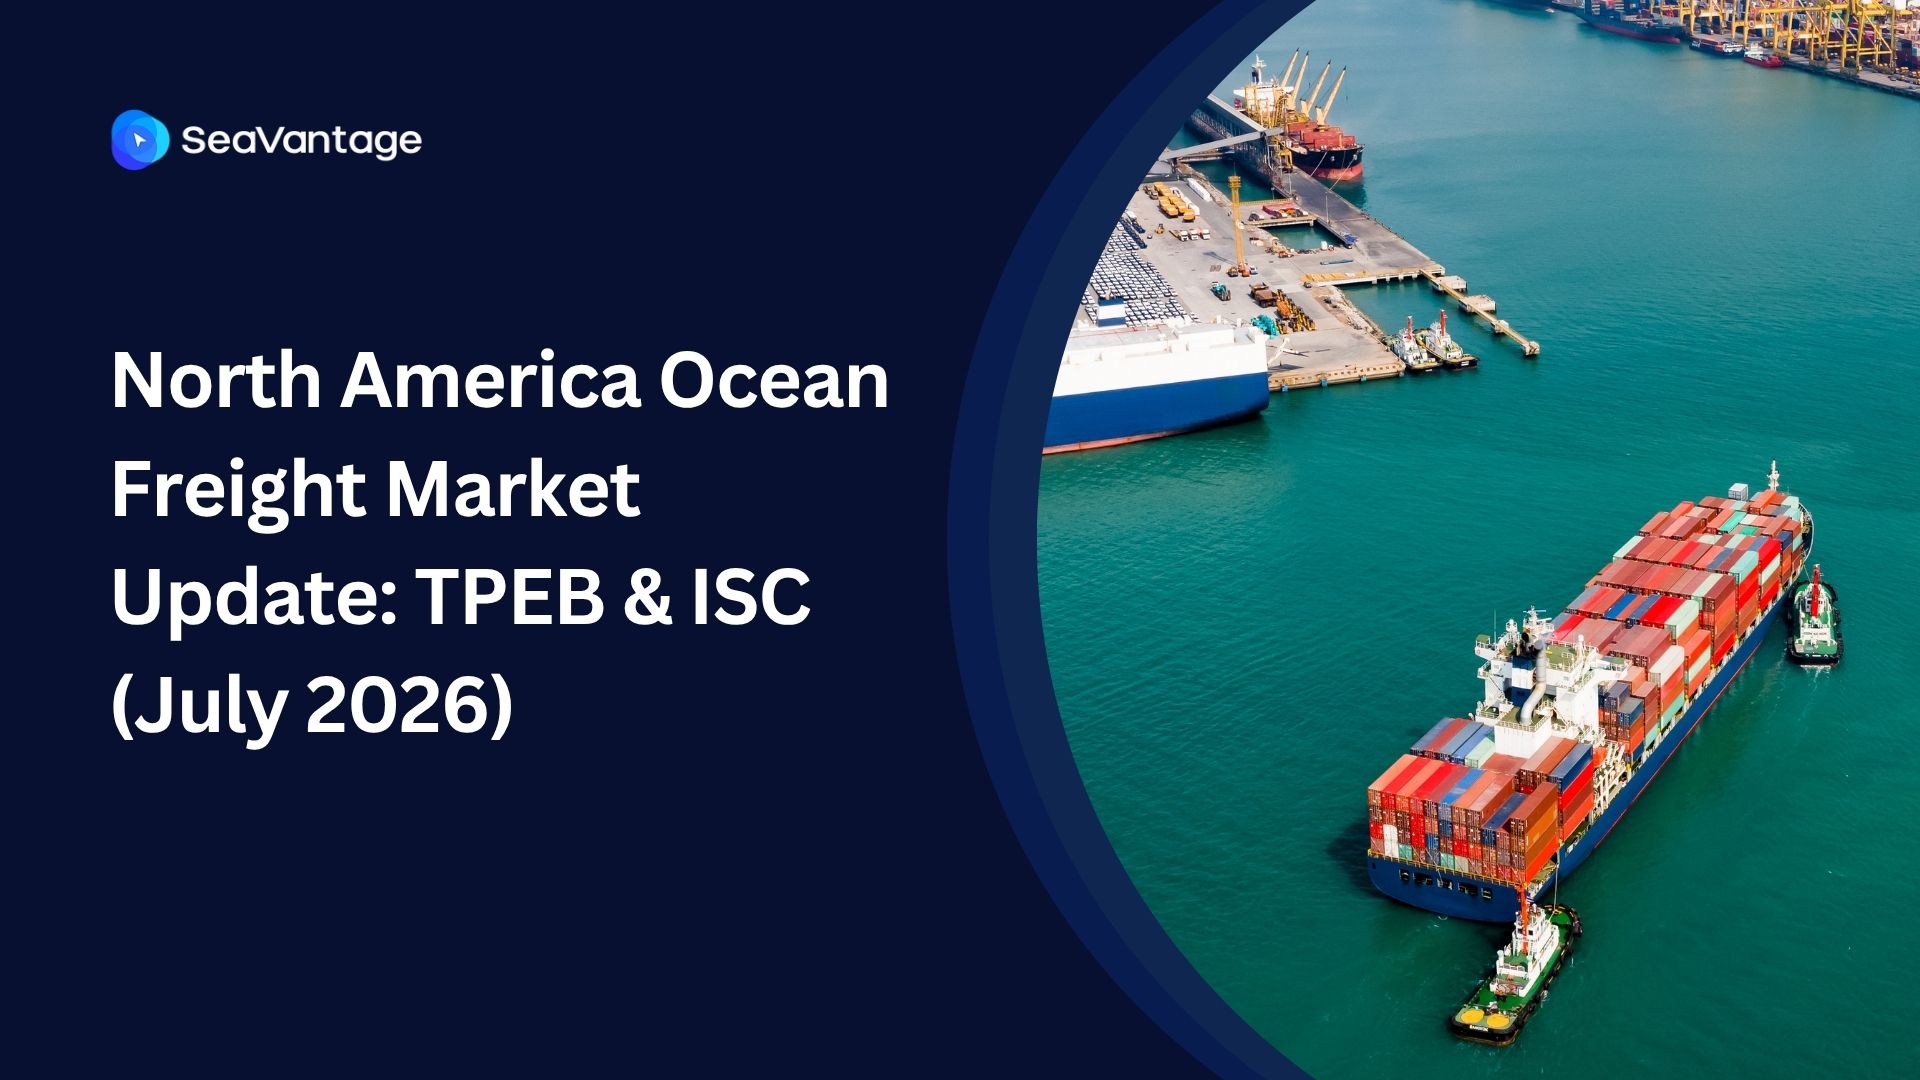
TPEB rates 2026, Indian Subcontinent ocean freight capacity, Strait of Hormuz shipping disruption, schedule reliability ocean carriers
What's driving ocean freight peak season 2026 — rates, surcharges, booking windows, and how to avoid missed inventory deadlines.

.png)


