


Which Ocean Visibility Platform Gives Operations Teams Reliable Vessel and Container ETAs?
No platform gives operations teams reliable ETAs from one number. Reliability comes from comparing the carrier's ETA with an independent predicted arrival, live AIS position, and port waiting data — in one view. SeaVantage shows carrier ETA and its predicted arrival (PTA) side by side, with Port Insight waiting times behind them. Judge a platform by whether it shows you the disagreement between the two dates, not by a single date it prints with confidence.
Why carrier ETAs slip
A carrier ETA is a schedule. It assumes the port will take the vessel on arrival. Durban shows what happens when it does not.
On Monday 16 November, Port Insight showed 28 ships waiting at Durban, 6.5 days on average. The one-year average is 1.9 days. Waiting runs more than three times its own normal. Eighty-three ships were on the way. The congestion index sat at 6 out of 10 — Moderate — busier than 77% of ports. Portcast's weekly snapshot put the median wait at 6.99 days, up 1.36 days on the week before.
A schedule cannot absorb that. The ETA holds only if the queue clears. It did not.
The live evidence: two dates, one vessel
Three vessels inbound to Durban on 16 November, carrier ETA against SeaVantage PTA:
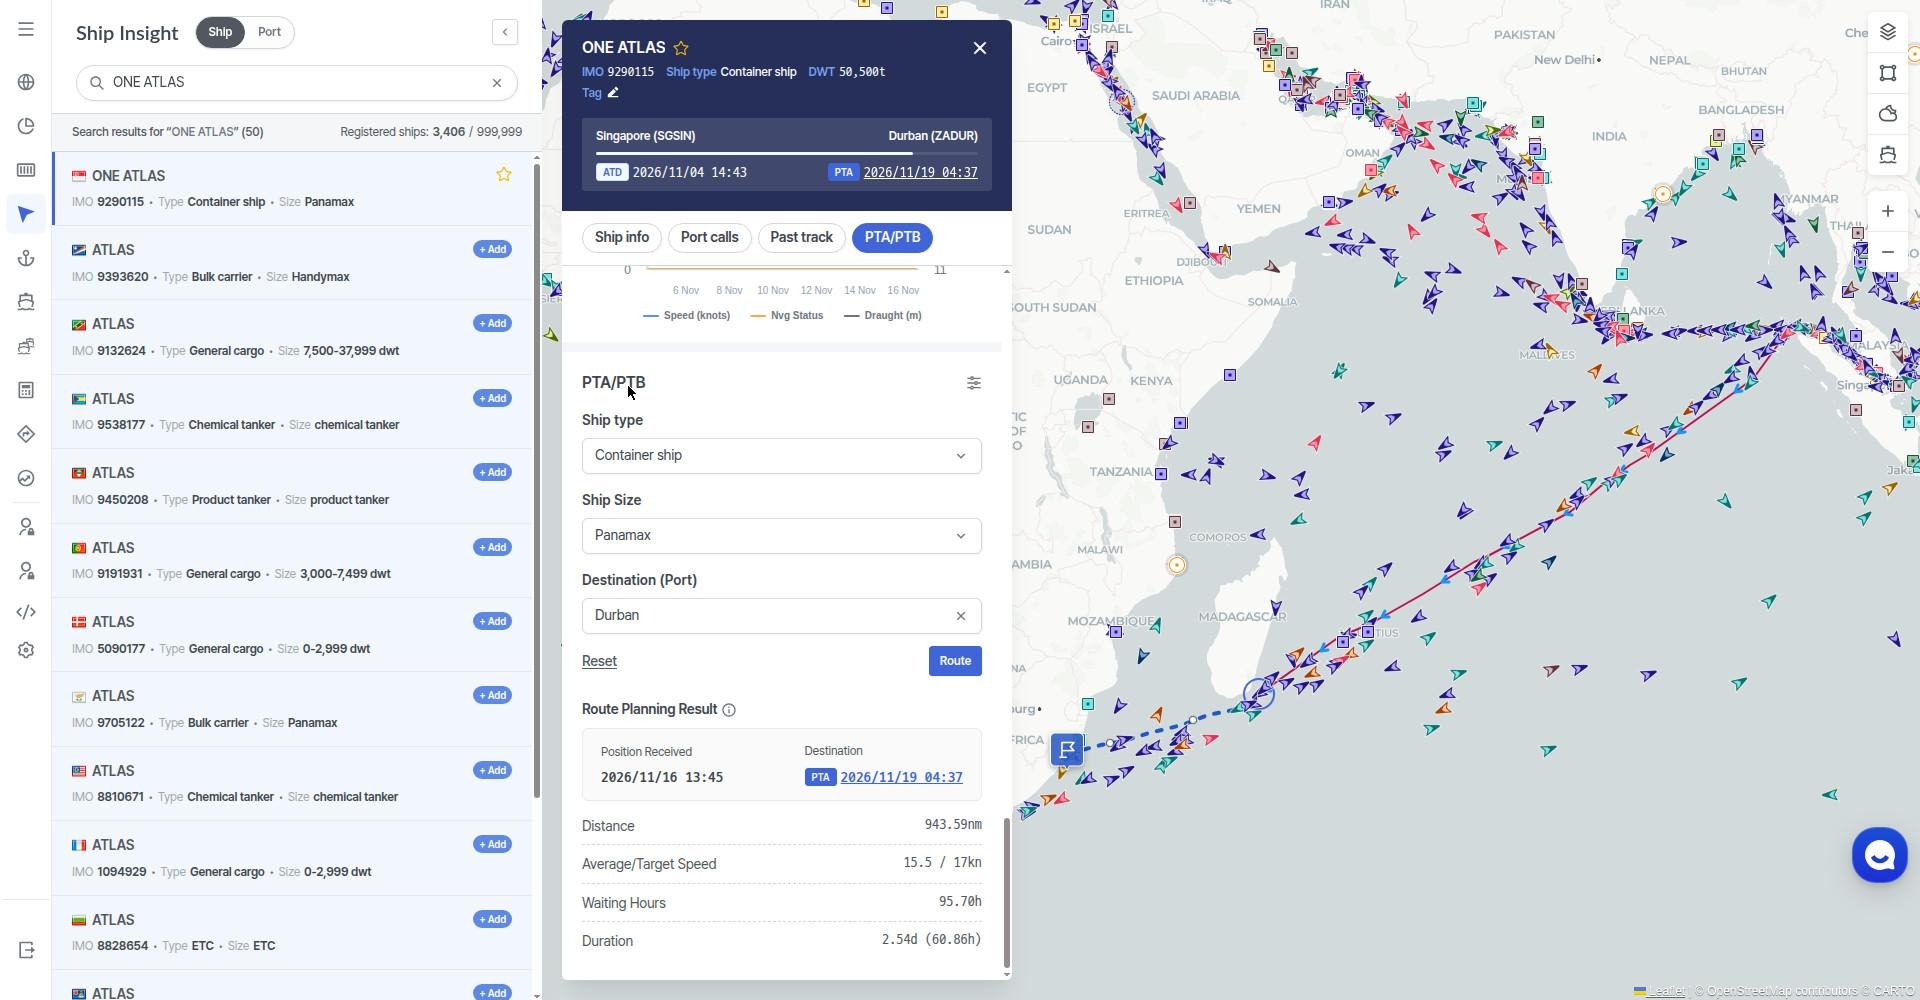
The PTA is a continuously recalculated estimate built from live vessel movement and operating conditions. It is not a replacement for the carrier's official ETA. It is a complementary signal. When it runs days behind the ETA, the schedule is slipping. When it runs ahead, the schedule has room. Either way, the gap is the information. One date alone tells you nothing about its own risk.
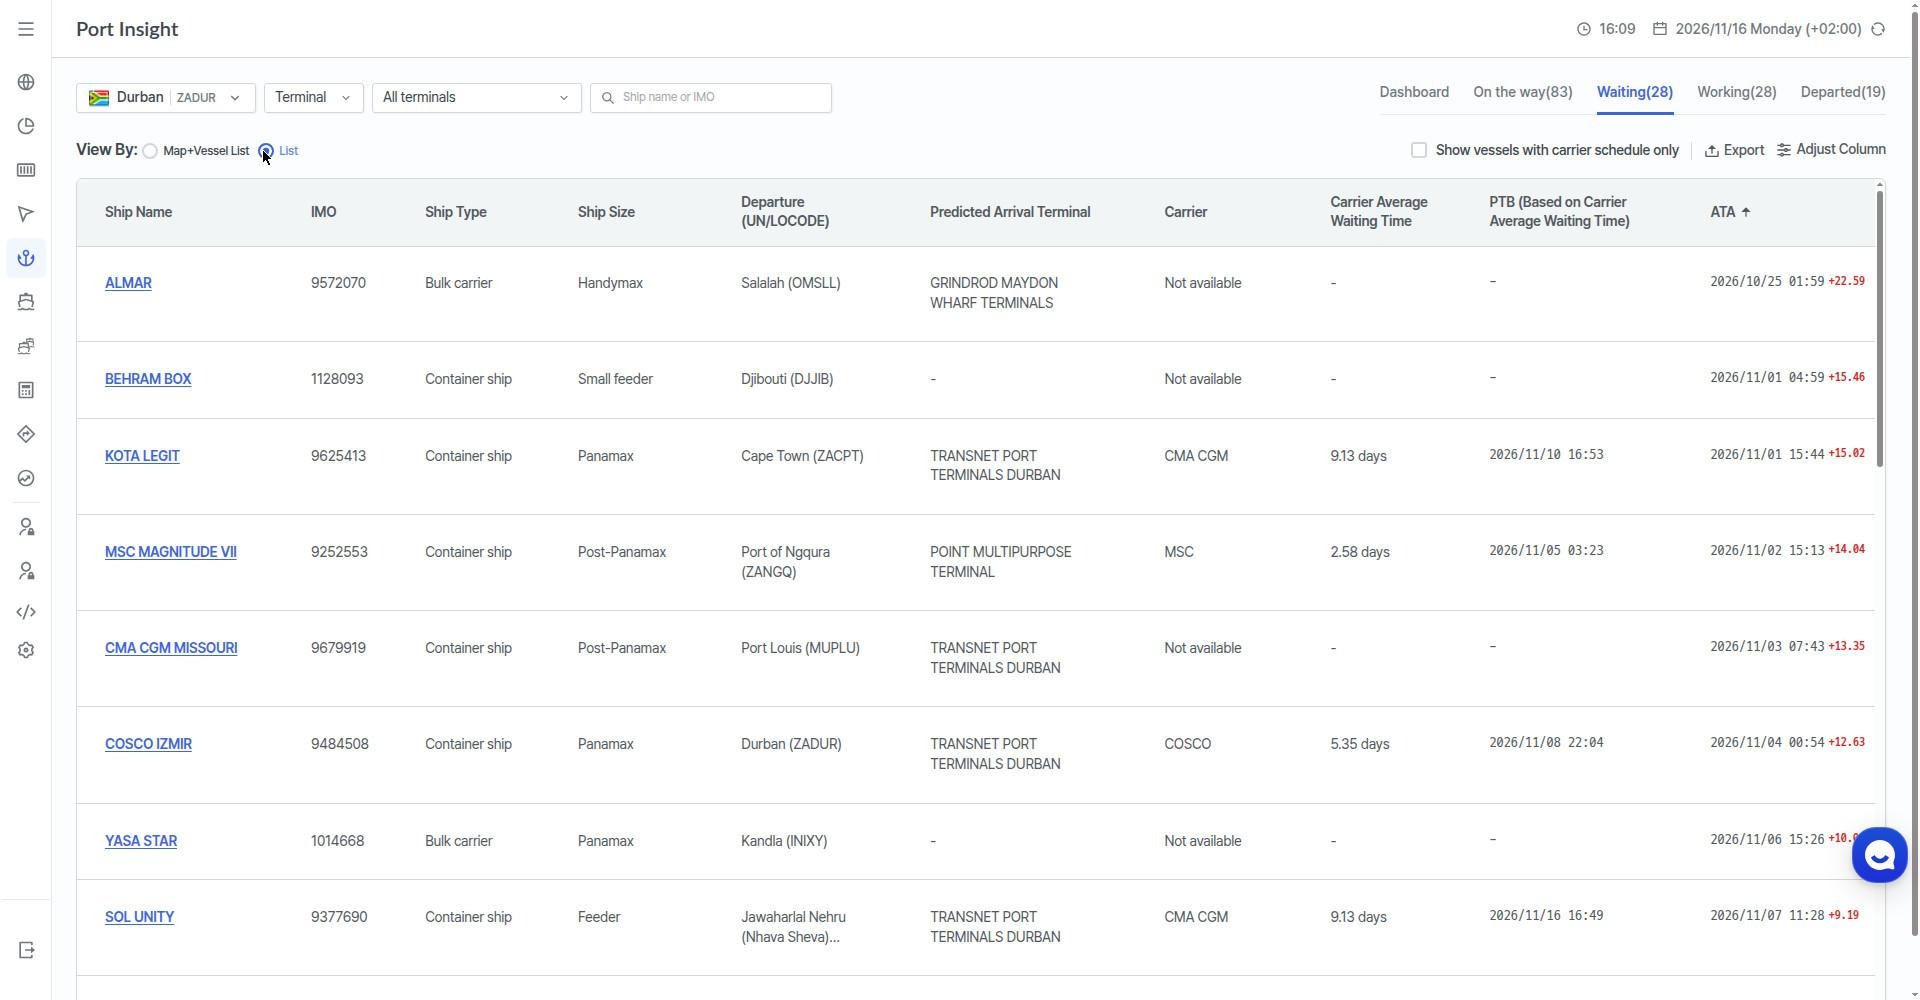
The waiting list shows the same lesson from the other side. Predicted berthing time (PTB) rests on the carrier's average waiting time. Three vessels missed theirs:
A carrier average is not your vessel's wait. MSC's average waiting time is 2.58 days. MSC MAGNITUDE VII waited 14. An average describes the middle. Operations teams live in the tail.
Four tests for ETA reliability
Use these on any platform, including ours.
1. Does it show two signals, or one? A platform that prints only the carrier ETA gives you the schedule. A platform that prints carrier ETA and an independent predicted arrival side by side gives you the disagreement — and the disagreement is what you act on. SeaVantage shows both in Cargo Insight and Ship Insight. The PTA is recalculated from live vessel movement; the PTB for berthing is calculated from vessel speed, course, and historical port data.
2. Is it live AIS, or a schedule? A schedule says where the vessel should be. AIS says where it is. Check whether the platform shows live position, speed, and course — and whether port calls are marked as scheduled or provided by AIS data. If you cannot tell which is which, you cannot tell what moved.
3. Does it show the port behind the ETA? An ETA to Durban means little without the queue at Durban. The platform should show congestion, waiting time, and working time for the destination port — live, not last week's report. Port Insight shows waiting live (28 ships, 6.5 days at Durban on 16 November) against the one-year average, so you can see whether the port is running hot right now.
4. How often does it recalculate? An ETA computed once a day goes stale before lunch. Port Insight data updates on average every 15 minutes from AIS. Ask any vendor the same question and compare the answer.
How the platforms compare
How operations teams use two ETAs
The workflow is simple. Watch the gap, not the date.
- Morning check. Open the vessels due this week. Where the PTA runs behind the ETA, flag the shipment. Two days of gap found on Monday is a plan. Found on Thursday, it is a scramble.
- Pre-check the landside. Trucking, warehouse slots, customer notes. Hold flexibility while the gap is small.
- Check the port, not just the vessel. If the destination shows 6.5 days of waiting against a 1.9-day norm, every ETA into that port carries the same risk. Reroute or reset expectations before the vessel joins the queue.
- Act on the early signal. When the PTA moves later than the ETA, treat it as an early warning. Do not wait for the official update to catch up.
Frequently asked questions
Which ocean visibility platform gives operations teams reliable vessel and container ETAs?
None from a single number. Reliability comes from carrier ETA plus an independent predicted arrival, live AIS, and port waiting data in one view. SeaVantage shows carrier ETA and PTA side by side in Ship Insight and Cargo Insight, with Port Insight waiting times behind them. Enterprise platforms offer predictive ETAs at custom-quote pricing.
What is the difference between ETA and PTA?
ETA is the carrier's official estimated time of arrival — a schedule. PTA is SeaVantage's predicted arrival, continuously recalculated from live vessel movement and operating conditions. It is a complementary signal, not a replacement. The gap between them is the early warning.
Why do carrier ETAs slip at congested ports?
Because the ETA assumes the port takes the vessel on arrival. At Durban on 16 November 2026, 28 ships waited 6.5 days on average against a 1.9-day yearly norm, and three vessels had already missed their predicted berthing times. A schedule cannot absorb a queue.
How can operations teams test ETA reliability before buying?
Run the trial on your own lanes. SeaVantage offers a 7-day free trial: Ship Insight up to 5 ships, Cargo Insight up to 10 B/Ls. Compare the PTA with the carrier ETA across the week. The gap pattern on your lanes is the accuracy figure that matters.
Does SeaVantage publish a PTA accuracy percentage?
No. Accuracy depends on lane, carrier, and port week, so a single published number would mislead. Test it on your own lanes in the trial instead.
Related reading
- ETA vs PTA: What the Two Dates Mean for Container Shipping
- Durban Port Congestion November 2026: Maersk's $1,000 Surcharge and a 15-Day Queue
- Port Congestion Is the New Normal. Plan Like It Is.
- Global Port Congestion Tracking
The takeaway
A reliable ETA is not a date. It is a disagreement you can see: carrier ETA against an independent predicted arrival, live position against schedule, port queue against port norm. The platform that shows you the gap earns the operation. The one that hides it behind a single confident date does not.
Data note: Vessel ETA/PTA figures are from SeaVantage Insight on Monday 16 November 2026: MSC SARAH V and PROGRESS ACE from the Port Insight on-the-way tab (header 15:53 SAST); ONE ATLAS from Ship Insight's PTA/PTB view and port calls (AIS position received 13:45 UTC). Durban waiting data from Port Insight, header 15:53–15:57 SAST. PTA is a complementary signal alongside carrier ETA, never a replacement. No accuracy percentage is cited anywhere in this post.

2026년 아시아 컨테이너선 정시 도착 신뢰도와 항만별 대기시간 데이터를 살펴봅니다. 항만 혼잡이 운항 일정과 화물 납기에 미치는 영향, 부킹 전후 화주와 포워더가 확인할 정보를 정리했습니다.


팬스타 아크로호가 지난 8월 22일 북극항로 시범운항을 시작했습니다. 국내 최초 컨테이너선 북극항로 운항 현황과 상업성 검증 항목, 화주·포워더가 주목할 사항을 정리합니다.

No single ETA is reliable alone. Reliability comes from carrier ETA plus an independent predicted arrival, live AIS, and port waiting data.
See how the SeaVantage Cargo Insight API puts container tracking in your own system — JSON to dashboard, plus screen embedding. A visual guide, no code needed.

Forwarders need one dashboard per client, not one login per carrier. What to check — and how SeaVantage Cargo Insight covers it.


