


Global Freight Trends 2026: Ocean Stability vs. Air Cargo Surge
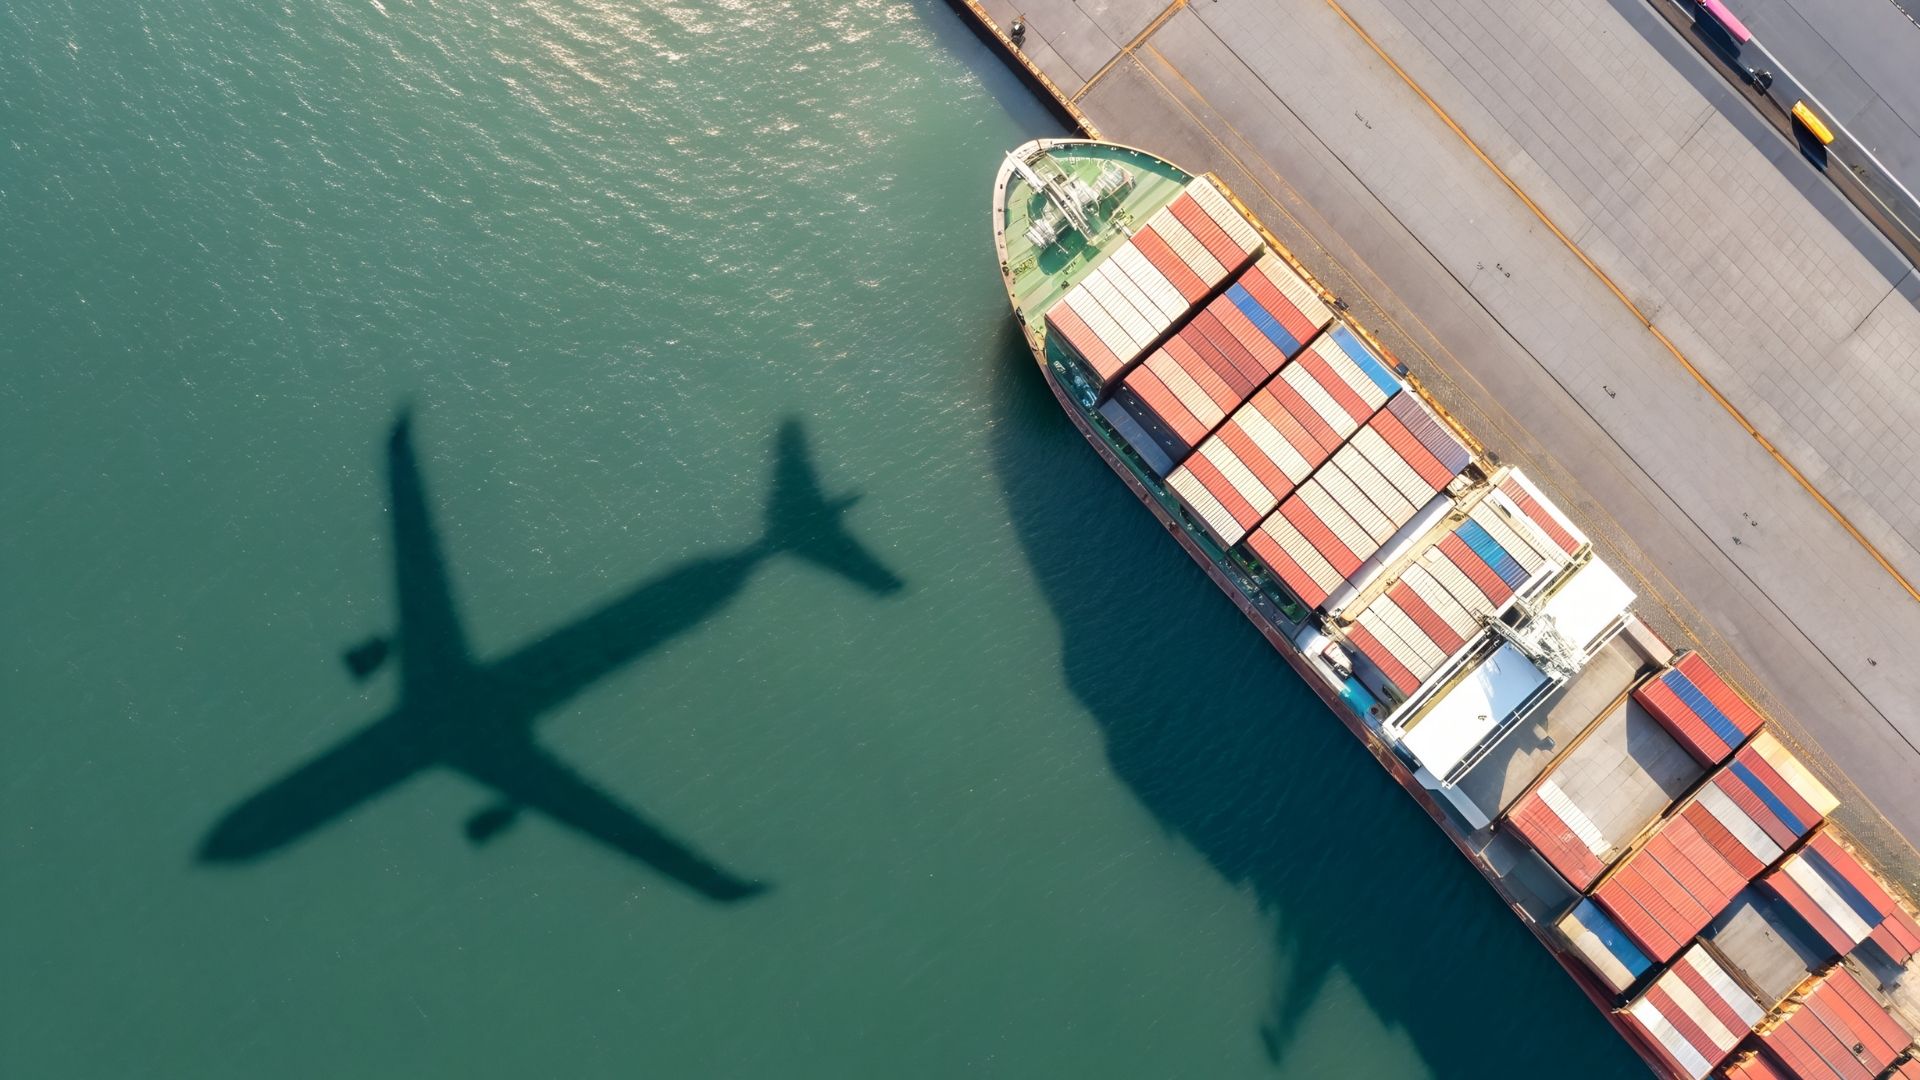
The global freight market is a complex web of conflicting signals and regional volatility. With headlines constantly shifting, what's really happening on the ground, at the ports, and in the air?
For supply chain leaders, accurate forecasting now requires more than just tracking shipments; it requires real-time supply chain visibility to navigate the widening gap between modes. This article cuts through the noise to deliver four key takeaways from the latest market data, giving you a clearer picture of the landscape ahead.
Takeaway 1: Houston is Booming, But Can Its Infrastructure Keep Up?
The Port of Houston has seen significant positive developments. The recent widening of the main ship channel—part of the massive Project 11 expansion—now allows for two-way container ship traffic and has lifted previous daylight-only transit restrictions, drastically increasing efficiency.
This has supported a steady rise in volume, with year-to-date containerized imports growing 6% and exports up 8%. This trend accelerated sharply in October, with exports surging 38% over the previous year while imports rose 11%. Looking ahead, major shippers like electronics manufacturer Foxconn plan to increase exports from Houston in 2026.
However, this rapid growth presents challenges. The port still requires ongoing emergency dredging to manage silt buildup. More critically, landside infrastructure development is expected to lag vessel capacity, creating a structural risk of inland bottlenecks. This dynamic sets the stage for future congestion, including potential shortages of chassis and rail cars. Shippers must factor container dwell time risks into their 2026 strategic planning to avoid costly delays.
Takeaway 2: Global Congestion is a Game of Whack-a-Mole
Widespread congestion and delays continue to plague major international ports, but the hotspots are constantly shifting.
- Asia: Shippers face 3-5 day berth congestion in Manila, 2-day waits in Singapore, and heavy congestion in Qingdao, while high winds cause further delays from Korea to Malaysia.
- Europe: Persistent congestion at Rotterdam is forcing vessel diversions, and both Antwerp and Hamburg are also experiencing significant delays.
In contrast, North America presents a mixed but more stable picture. Rail dwell times at the key West Coast ports of LA/Long Beach are stable at 2-3 days, and Oakland operations are fluid. In the Pacific Northwest, Seattle and Tacoma report 3 days of rail dwell, while Prince Rupert and Vancouver are at 2 days, though Canada faces predictable winter rail delays.
The brightest spot is the U.S. East Coast, where ports report no delays and fluid rail operations. This regional divergence underscores the need for shippers to build optionality into their routing. Utilizing global port congestion tracking can help you favor the fluid U.S. East Coast to de-risk your supply chains from recurring West Coast and international volatility.
Takeaway 3: The Pacific Offers a Rare Breath of Air (For Now)
Part of the reason for the relative stability on the U.S. West Coast is a surprising calm on the ocean. Contrary to the typical pre-holiday rush, Trans-Pacific Eastbound (TPEB) ocean freight capacity and space remain healthy.
This unusual stability is a direct result of a late Chinese New Year, which falls in mid-February. The typical demand surge that occurs 6-8 weeks prior to the holiday has not yet begun, resulting in a softer-than-usual December market.
Projections show that total TPEB capacity for January is higher than it has been for the Chinese New Year period of the last two years. This provides a temporary window of opportunity for shippers, but as we have seen in our ocean visibility analysis, you should be prepared for demand and pressure to ramp up quickly as the new year approaches.
Takeaway 4: While the Ocean Simmers, the Air Freight Market is Boiling Over
In stark contrast to the relative calm on the Pacific, the global air freight market is experiencing a "super peak." The primary drivers for this surge are a faster-than-anticipated demand recovery fueled by two distinct, powerful trends:
- A strong e-commerce recovery from China growing at a 20% clip.
- A separate 20% year-over-year growth in AI-driven demand (server components and chips).
This explosion in demand is outpacing supply growth from Asia, causing spot rates to rise to the same levels seen during the 2024 peak. The capacity crunch is severe; for example, all air space from Vietnam to the US is fully booked until mid-December. The 2026 outlook anticipates continued elevated rates and volatility from Asia, with a particularly strong Q4 peak expected due to the continued rise of e-commerce and AI.
Conclusion: A Tale of Two Markets
The global freight market is defined by a core tension: pockets of stability and opportunity in ocean freight exist alongside widespread regional volatility and a super-heated air cargo sector. This divergence between modes and regions creates a complex planning environment.
As these trends continue into 2026, building resilience into your supply chain is non-negotiable. Whether it is monitoring Port Houston's expansion or navigating the air cargo crunch, SeaVantage provides the predictive visibility you need to navigate both the calm and the storm.
Frequently Asked Questions (FAQ)
Why are air freight rates rising so quickly in late 2025?
Air freight rates are experiencing a "super peak" driven by two main factors: a 20% growth in e-commerce volume from China and a surge in demand for AI-related hardware. This demand is currently outpacing available capacity, leading to fully booked flights and higher spot rates.
Is the Port of Houston experiencing congestion?
While the waterside operations at the Port of Houston have improved due to the Project 11 channel expansion, landside infrastructure is struggling to keep up with the rapid growth in export and import volumes. This imbalance creates a risk of inland bottlenecks, chassis shortages, and potential rail delays in 2026.
What should shippers expect for Trans-Pacific ocean freight in early 2026?
Currently, the Trans-Pacific market is stable due to a late Chinese New Year (mid-February). However, capacity is expected to tighten in January as the pre-holiday rush begins. Shippers should utilize this current window of stability but prepare for rate increases and space constraints closer to February.
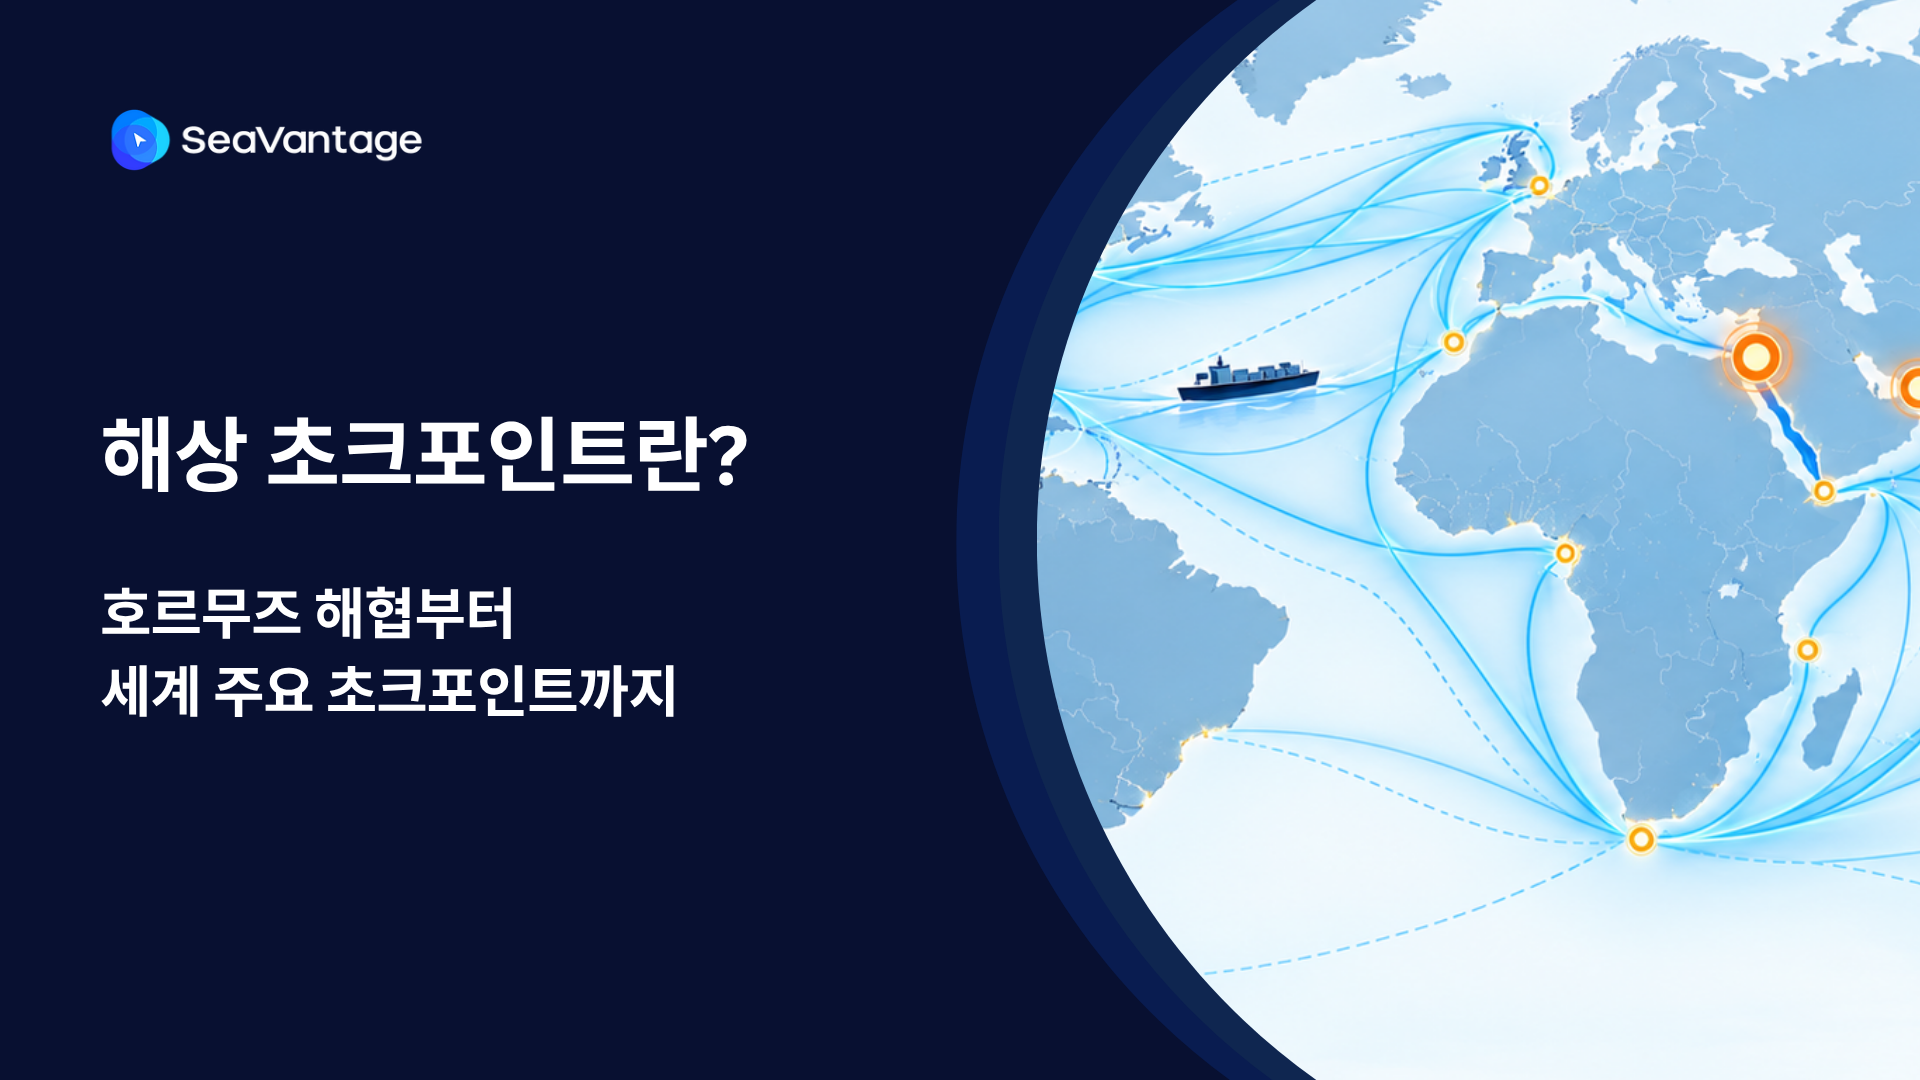

팬스타 아크로호가 지난 8월 22일 북극항로 시범운항을 시작했습니다. 국내 최초 컨테이너선 북극항로 운항 현황과 상업성 검증 항목, 화주·포워더가 주목할 사항을 정리합니다.
태풍 발생 시 선박은 우회·감속·대기 등 서로 다르게 대응합니다. AIS 항적과 ETA·PTA·PTB, 항만 혼잡 데이터를 활용해 해상운송 지연 가능성을 판단하는 방법을 알아보세요.
Need a SeaRates alternative? See how SeaVantage Cargo Insight supports container tracking, predicted arrivals, shipment milestones, and API access.
TPEB rates 2026, Indian Subcontinent ocean freight capacity, Strait of Hormuz shipping disruption, schedule reliability ocean carriers
What's driving ocean freight peak season 2026 — rates, surcharges, booking windows, and how to avoid missed inventory deadlines.

.png)


