


Ocean Freight Outlook: Why Chokepoint Risk Matters More as Carriers Return to Suez

The ocean freight market is entering an unusual phase.
Some shipping routes are beginning to normalize. Container carriers are steadily returning services to the Red Sea and Suez Canal. Panama Canal conditions have improved. Trans-Pacific peak demand appears to be easing.
At the same time, geopolitical and operational risk remains high enough that a single chokepoint event can rapidly change vessel routing, available capacity, fuel costs and transit times.
For BCOs, freight forwarders and ocean shippers, the takeaway is simple:
Do not mistake route recovery for the end of disruption risk.
The better question is whether vessels are actually returning to a route consistently, and whether traffic, risk and alternative-route activity confirm the same story.
That is increasingly something shippers can measure.
What is happening in the ocean freight market right now?
Three trends are developing simultaneously:
- Container services are returning to the Suez Canal and Red Sea.
- Security risk remains elevated in and around the Middle East, including the Strait of Hormuz.
- Capacity and rates remain affected by congestion, blank sailings, fuel costs and earlier rerouting decisions.
That combination makes the market harder to interpret than a simple "normal versus disrupted" framework.
In early October, carriers began a more structural return to Suez after years of Cape of Good Hope diversions. The strongest initial return was on Far East-Mediterranean services, while some North Europe and Indian Subcontinent services were also moving back through Suez.
The return has accelerated since then.
By October 29, Alphaliner's survey of the ten largest carrier networks showed nearly two-thirds of deployed Asia-Europe capacity routing through the Red Sea. The share was 70% for Mediterranean services and 58% for North Europe.
But that recovery is not happening in a low-risk environment.
Earlier in October, attacks on commercial ships near Hormuz escalated, and some of the targets were container vessels.
A route can be recovering operationally while remaining exposed strategically.
Is container shipping returning to the Suez Canal?
Yes, but the return is uneven and should not yet be treated as a simple return to pre-disruption routing.
Carriers have been restoring Suez routings selectively. Far East-Mediterranean trades moved first because the transit-time saving versus the Cape of Good Hope is especially large there. Some North Europe loops use Suez in only one direction and still route around the Cape in the other.
That selective approach is important.
A carrier can technically "return to Suez" without having restored its entire network.
For shippers, service-level routing matters more than the headline that "Suez is reopening."
What should shippers monitor?
- Which individual services return
- Whether the routing applies in both directions
- Whether schedules actually shorten
- Whether blank sailings change
- Whether vessels arrive earlier than terminals expected
- Whether carriers redeploy vessels released by shorter rotations
Those network effects can take weeks to move through a container system.
Why a Suez return could release container capacity
Rerouting around the Cape of Good Hope does more than add transit time.
It also consumes vessel capacity.
A container ship that spends additional days at sea remains unavailable for its next rotation. Multiply that across many services and a routing disruption can absorb a meaningful share of global fleet capacity without underlying cargo demand increasing.
October market estimates put Cape-routed services at roughly 20% to 25% of weekly U.S. East Coast capacity. Shorter Suez routings could eventually release vessels for deployment elsewhere.
Shorter rotations -> fewer vessel-days per service -> capacity released -> more deployment flexibility
But that does not automatically mean freight rates fall immediately.
Why container rates can rise even as capacity returns
This is one of the more counterintuitive features of the current market.
More efficient routes would normally increase effective vessel supply.
Yet Asia-Europe freight rates rose over the month to early November even as carriers returned more services to the Red Sea. Northern Europe rates were up 10% and Mediterranean rates 23%, with congestion, cargo backlogs and capacity management helping hold prices up.
Carriers were also using blank sailings to restrict available capacity while congestion continued at Northern European and Asian ports.
So shippers should avoid this assumption:
Suez return = more capacity = lower rates immediately.
The actual chain is more complicated:
- Suez return
- Shorter theoretical rotations
- Ships can arrive earlier than Cape-based schedules anticipated
- Terminal arrivals bunch together
- Port congestion may temporarily increase
- Carriers continue managing capacity
- Rates can remain elevated
In other words, network normalization can itself create short-term disruption.
That is precisely why vessel-level and route-level visibility matters.
What does Strait of Hormuz risk mean for container freight?
Hormuz is primarily associated with energy shipping.
That can lead container shippers to underestimate its relevance.
But container freight can be exposed through at least four channels:
1. Gulf port access
Container services calling Gulf ports must transit the Strait of Hormuz. Disruption can therefore affect schedules, feeder connections, booking acceptance and port calls even if global container volumes through the strait are relatively small.
2. Bunker costs
Changes in oil prices can feed through to marine fuel costs and eventually bunker adjustment mechanisms.
3. Insurance and security costs
Higher perceived vessel risk can increase war-risk insurance and other voyage-related costs.
4. Global carrier rotations
A ship delayed on one service does not simply disappear from the network. The ship returns late to the next rotation. That can affect later port calls, connections, blank sailings, schedule reliability and empty-container positioning.
This is how a geographically contained event becomes a network problem.
What are vessel movements telling shippers?
This is where SeaVantage's approach differs from simply following headlines.
The SeaVantage Strait of Hormuz Live Tracker tracks both vessel activity and route risk. Ship positions update every 15 minutes, while risk and transit data refresh daily. The monitor combines four separately calculated signals. The resulting risk index ranges from 0 to 100.
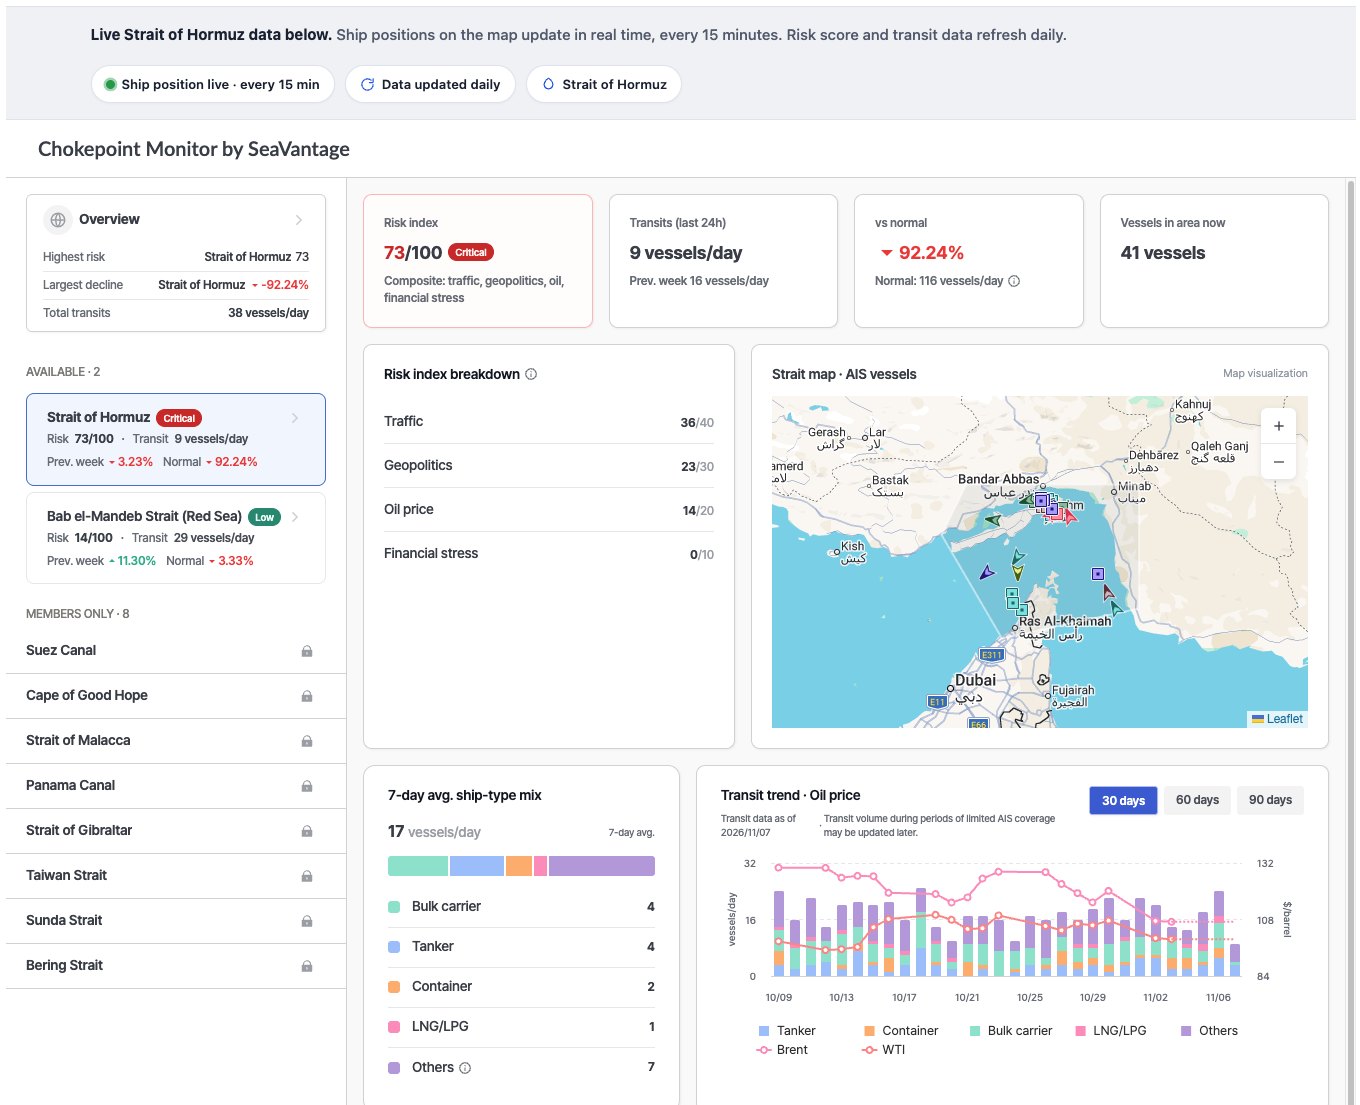
This matters because a headline and an operational disruption are not the same thing.
A security incident may increase geopolitical risk while commercial traffic continues normally.
Conversely, a sustained traffic decline can show that vessel operators are changing behavior before the full commercial impact reaches a shipper.
The strongest signal is therefore not a single number.
It is the relationship between risk + vessel transits + change versus normal + the situation driving the change.
The broader SeaVantage Global Shipping Chokepoint Monitor applies the framework across nine major routes.
Why current Hormuz risk deserves special attention
The risks are no longer theoretical for container operators.
On October 16, attacks on vessels around the Strait of Hormuz escalated. The 2,824-TEU GFS Pride sank after being struck while transiting the strait. A second container vessel, GFS Giselle, was also struck but reached safe anchorage.
Another issue matters particularly to BCOs and freight forwarders: cargo may move aboard feeder vessels through slot-sharing arrangements, so the vessel physically carrying a container may not be owned by the carrier named on the bill of lading. That can complicate insurance and risk exposure.
That is a practical reason not to stop risk analysis at the carrier name.
For Gulf-connected cargo, shippers should understand:
- The actual operating vessel
- Feeder arrangements
- Transshipment points
- Carrier advisories
- War-risk coverage
- Contractual surcharge mechanisms
Panama is moving in the opposite direction
Not every chokepoint signal is deteriorating.
The Panama Canal Authority reported that fiscal-year 2026 transits increased 4.1% to 13,951 and tonnage increased 6.5% to 521 million PC/UMS tons. The canal also maintained a maximum 50-foot draft through its dry season.
That creates an important broader lesson.
Global supply-chain risk should be monitored as a network, not as a list of crises.
Some routes improve while others deteriorate. Some diversions absorb capacity. Others release it. A route coming back online can be almost as consequential to vessel networks as a route closing.
What should BCOs and freight forwarders watch now?
Rather than trying to predict the next geopolitical event, we recommend watching five operational signals.
1. Vessel traffic versus normal
Ask: Are ships actually using the route? A sustained change in completed transits gives you evidence of operator behavior, not sentiment.
2. Direction of risk
Ask: Is risk improving, stable or deteriorating? The direction can matter as much as the absolute score.
3. Alternative-route traffic
Ask: Where are the ships going instead? If Bab el-Mandeb traffic falls, watch the Cape. If Panama capacity changes, watch how service strings and East Coast routings respond. Traffic rarely disappears. It relocates.
4. Carrier service changes
Watch individual loops rather than broad statements about a carrier "returning" to a route. The current Suez recovery demonstrates why. A carrier can use one route eastbound and another westbound.
5. Rate and fuel signals
Route normalization does not guarantee rate normalization. Congestion, blank sailings, bunker costs and carrier capacity management can keep prices elevated after the physical route improves.
What should ocean shippers do in Q4 2026?
For BCOs and freight forwarders, we recommend five practical actions.
Map chokepoints to trade lanes
Do not begin with a geopolitical event. Begin with your container flows. Identify which chokepoints sit behind Asia-Europe, Asia-Mediterranean, Asia-U.S. East Coast, Gulf services, Indian Subcontinent services and transshipment routes.
Revisit lead-time assumptions
Do not automatically reverse Cape-era inventory buffers because a carrier announces a Suez return. Confirm the actual service string and direction first.
Monitor schedule integrity, not just published transit time
A shorter published transit means little if congestion or bunching reduces schedule reliability.
Check contract exposure
Review BAF mechanisms, war-risk clauses, emergency surcharges, quote-validity periods and force majeure language.
Establish an internal early-warning trigger
For example: rising route risk plus sustained traffic contraction equals operational review. That does not mean reroute automatically. It means someone owns the decision before the carrier email arrives.
Frequently asked questions
Is container shipping returning to the Suez Canal?
Yes. The return accelerated during October 2026, although routing remains uneven by carrier, service and direction. Alphaliner's survey found 63% of deployed Asia-Europe capacity among the ten largest carrier networks using the Red Sea by late October, with higher penetration on Mediterranean services than Northern Europe.
Will returning to Suez lower container freight rates?
Not necessarily in the short term. Shorter routes can release effective vessel capacity, but congestion, blank sailings, bunker costs, backlogs and carrier capacity management can keep rates elevated. Asia-Europe prices increased during October even as Red Sea services returned.
Why does the Strait of Hormuz matter to container shippers?
Hormuz matters through Gulf port access, fuel costs, insurance, security risk and carrier-network effects. Recent attacks have also directly involved container ships, so container exposure is not purely indirect.
How can shippers monitor Strait of Hormuz risk?
SeaVantage's live tracker combines vessel traffic, geopolitical risk, Brent crude and financial stress into a transparent 0-to-100 risk index. Ship positions update every 15 minutes and the risk and transit data update daily.
What is the best early-warning signal for a chokepoint disruption?
There is no single perfect indicator. We recommend reading route risk together with vessel transits and change versus normal. Falling traffic combined with rising risk is a stronger operational warning than either measure on its own. SeaVantage's methodology is designed around that combined view.
The takeaway
The ocean freight market is not simply moving from disruption back to normal.
It is moving into a more complicated phase.
Suez is recovering while Middle East security risk remains elevated. Panama conditions have improved. Capacity is being released in some parts of the network while congestion and blank sailings constrain it elsewhere. Freight rates are not responding to any one factor in isolation: Asia-Europe rates rose through October even as Red Sea services came back.
For supply-chain teams, the advantage will not come from predicting the next closure.
It will come from recognizing when vessel behavior starts to change.
That means tracking chokepoints as a connected network and asking three questions every day:
- What is the risk?
- What are vessels actually doing?
- Where is the capacity moving next?
Track the Strait of Hormuz live with SeaVantage
View all nine global shipping chokepoints

팬스타 아크로호가 지난 8월 22일 북극항로 시범운항을 시작했습니다. 국내 최초 컨테이너선 북극항로 운항 현황과 상업성 검증 항목, 화주·포워더가 주목할 사항을 정리합니다.
태풍 발생 시 선박은 우회·감속·대기 등 서로 다르게 대응합니다. AIS 항적과 ETA·PTA·PTB, 항만 혼잡 데이터를 활용해 해상운송 지연 가능성을 판단하는 방법을 알아보세요.
Suez routings are returning, but faster voyages can create arrival bunching. Learn how predictive ETA and port congestion data improve European import planning.

Suez traffic is returning while Hormuz and Red Sea risks remain elevated. See what changing vessel routes mean for capacity, rates and ocean freight planning.
Need a SeaRates alternative? See how SeaVantage Cargo Insight supports container tracking, predicted arrivals, shipment milestones, and API access.


