
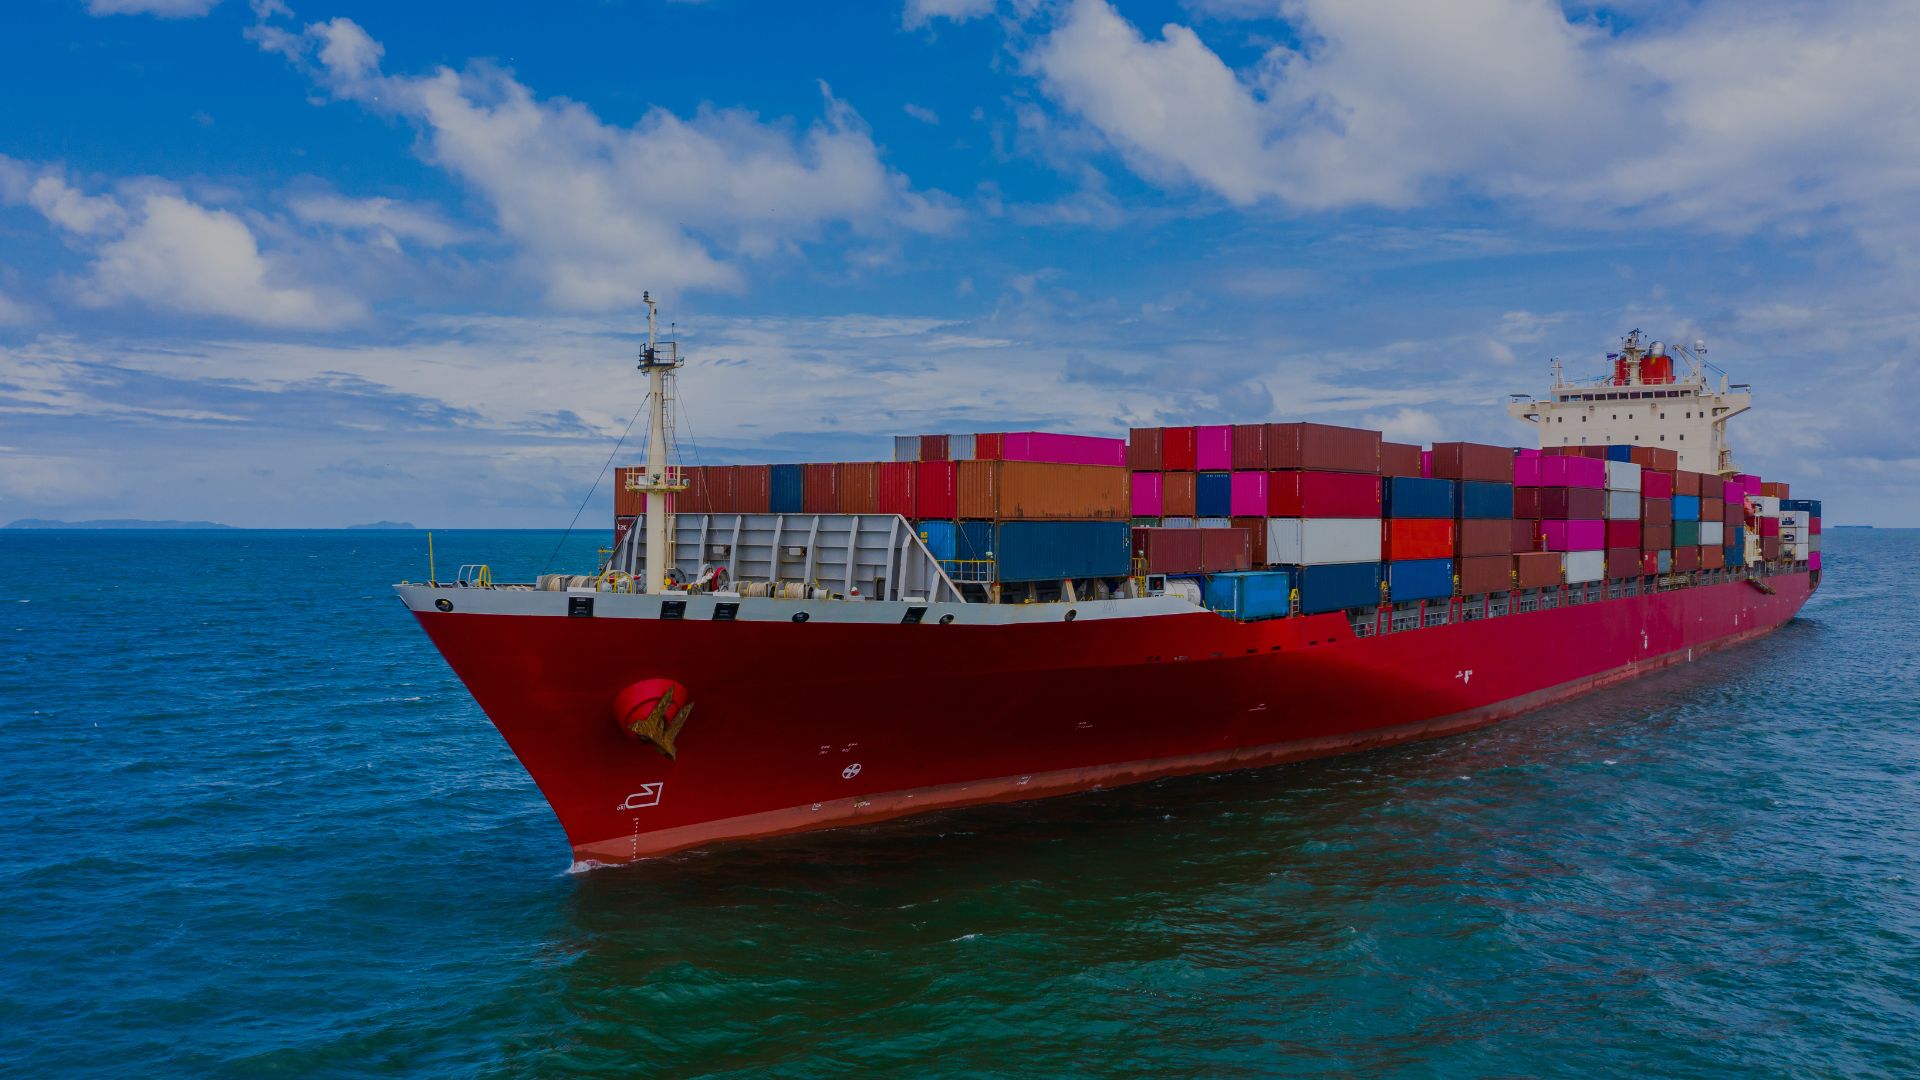
Ocean Freight Market Update – May 2026: Tightening Capacity, Rising Rates, and a Reshuffled U.S. Port Map
The transpacific is the tightest it has been since the post-Chinese New Year reset, U.S. import volumes are softening on aggregate, and the U.S. port hierarchy is quietly being redrawn. Here is what shippers need to know — and what to act on — before June.
Key Takeaways (TL;DR)
• U.S. inbound volume fell8.3% YoY in March 2026 to 1.97M TEUs (NRF Global Port Tracker).
• Transpacific Eastbound(TPEB) capacity deployment slipped to 82% – the lowest since post-CNY –removing roughly 25% of slots from the market.
• TPEB spot rates:~$3,800/FEU to the U.S. East Coast and ~$2,800/FEU to the West Coast as of May12, 2026 (SCFI).
• Capacity outlook: deployment is projected to climb to ~90% across PSW, PNW, and EC/Gulf gateways in June.
• The Strait of Hormuz remains closed; no widespread return to Suez routings, sustaining the long-haul capacity drag.
• Worst congestion right now: Qingdao (~4-day vessel waits), Manila North (3+ day berth delays), and Rotterdam/Hamburg (yards at80–89%).
If you only have five minutes to read about ocean freight this week, read this. May 2026 is shaping up as a turning point: the soft demand many forecasters expected to define the second quarter is colliding with an aggressive carrier capacity discipline strategy, and the result is a market that feels much tighter than the underlying volume numbers would suggest.
Below, we break down what is actually happening across the major trade lanes – grounded in the latest data from the NRF Global Port Tracker, Descartes Systems Group, Sea-Intelligence, and the SCFI – and translate it into the operational moves shippers should be making before the June service updates land.
1. U.S. Imports Are Down – But the Port Map Is Being Redrawn
Total U.S. containerized imports reached 1.97 million TEUs in March 2026 across the top 13 ports, an 8.3% year-over-year decline, according to the NRF Global Port Tracker. Descartes Systems Group, which tracks all U.S. ports, posted 2.35 million TEUs (-6.7% YoY). Both data sets confirm the same headline: nominal volume is contracting.
The more interesting story is underneath that headline. Cargo is rebalancing across gateways, with Gulf and East Coast secondary ports picking up share from West Coast majors.
Inbound Laden TEUs – March 2026 vs. March 2025
Despite the year-over-year softness, San Pedro Bay remains the structural anchor of North American ocean freight. Long Beach handled 374,412 inbound laden TEUs in March and posted a Q1 total of 2.39million TEUs – up 32.3% versus 2019. Los Angeles matched that 2.39 million-TEUQ1 figure (+8.2% vs. 2019). Savannah's 1.40 million-TEU Q1 was up 21.2% versus2019, reaffirming the East Coast's structural growth trajectory.
What this means for shippers: If your routing strategy is anchored on Los Angeles/Long Beach defaults, this is the right quarter to pressure-test alternatives. Houston, Virginia, and Vancouver are absorbing volume with healthier dwell profiles.
2. Why Are Ocean Freight Rates Rising When Volume Is Falling?
The decoupling between volume and rates is the defining feature of the May 2026 market. The short answer: carriers are managing supply faster than demand is falling.
TPEB Capacity Is Tighter Than Early 2026
• Average TPEB deployment for the second half of April through the first half of May sat at 82%.
• Week 20 was the lowest TPEB deployment seen since the post-Chinese New Year period.
• Blanked sailings clustered around the May Day holiday removed roughly 25% of nominal capacity from the market.
• The supply removal, combined with stable underlying demand, has produced rolling conditions on several corridors.
Gateway Deployment Outlook
Capacity is projected to climb back toward 90% across the major gateways through the second half of May and into June, although it could dip slightly because of late service disruptions and rotation changes.
TPEB Rate Trajectory
• March–April: Rate movements were driven primarily by fuel cost increases and carrier cost-management programs.
• May: Fuel and cost management are still factors, but the demand/supply balance is now the dominant driver of the rate floor.
• FEWB (Far East West bound): Mirroring TPEB with similar May supply restraints – Europe-bound rates are rebounding in tandem.
Spot Rate Snapshot (SCFI – May 12, 2026)
3. Global Port Congestion – Where Cargo Is Actually Moving
Visibility into where vessels are waiting and how long containers are dwelling is the single most valuable input for any shipper's routing decisions right now. Here is the May 2026 picture by region.
Asia
• China – North: Severe congestion at Qingdao with approximately 4-dayvessel waits. Shanghai and Ningbo are running 2–3 day delays.
• China – South: No material delays at South China ports – a clear advantage for shippers with origin flexibility.
• Southeast Asia: Yard density is improving at Singapore, with delays at ~1day. Port maintenance at Tanjung Pelepas is causing intermittent disruption.
• Philippines: Heavy berth congestion at Manila North, with delays running 3+ days.
• Indian Subcontinent: Equipment positioning is normalizing as weaker export demand prevents industry-wide imbalance.
Europe
• Rotterdam: Barge waits of 2–3 days; yard utilization at 80–88%.
• Hamburg: Yard at ~89%, vessel waits at ~2 days.
• Antwerp / Zeebrugge: Yard at 70–80%, berth delays of 1–2 days.
North America
• U.S. West Coast: Cargo is moving fluidly across all gateways. On-dock dwell is 2–3 days; rail dwell ~4 days.
• PNW + Canada: Moderate congestion at Prince Rupert; Vancouver, Seattle, and Tacoma fluid with 0–2 day dwell.
• U.S. East & Gulf: Savannah is seeing 2–4 vessels at anchor and 1–2 day berth delays. Other Southeast and Gulf ports remain manageable.
South America
• Weather disruptions in key soybean-producing regions have caused shipment bunching, with down stream effects on equipment availability.
4. The Red Sea & Strait of Hormuz – Why Suez Isn't Coming Back Yet
The geopolitical wildcard continues to shape the global capacity picture. The Strait of Hormuz remains closed to commercial traffic, and there has been no widespread return to Suez Canal routings for container vessels. The Cape of Good Hope detour continues to absorb capacity that would otherwise be available on Asia–Europe and Asia–U.S. East Coast lanes.
This is the structural force keeping a floor under ocean rates. Even with softening underlying demand, the effective fleet capacity in service to long-haul trades is reduced. Until carriers see a sustained, secured corridor through the Red Sea, expect this premium to persist.
5. What This Means for Shippers – Five Moves to Make Now
• Lock spot allocations early. TPEB tightness could roll into June. If you have flexible volume, secure space before the late-May service updates.
• Build a 7–14 day buffer for China-origin freight. Particularly through Qingdao and the Philippines, where berth wait times can compound rapidly.
• Test alternate U.S. gateways. Houston, Virginia, and Vancouver are growing for a reason – healthier dwell and capacity availability.
• Monitor vessel position and yard utilization in real time. Static schedules are not a reliable planning input in this environment. Live port-level intelligence is now table stakes.
• Watch the 2H May–June deployment ramp. If carriers execute the projected return to ~90% deployment cleanly, expect rate pressure to ease intoQ3. If demand outpaces the ramp, prepare for another leg up.
6. Outlook – Will Ocean Freight Rates Hold Through Q2 2026?
The open question for the rest of Q2 is whether demand rises to meet returning supply or stabilizes at current levels. Recent comparable cycles offer mixed signals: 2024 produced an unusually early peak season; 2025's mid-year strength was tariff-driven and front-loaded. Neither template maps cleanly to 2026.
What is different this year is the dual structural floor: persistently elevated fuel costs and the Hormuz/Red Sea risk premium. Even in a soft-demand scenario, those two forces limit how far spot rates can fall. The base case for the next 60 days is sustained elevated rates with corridor-specific volatility, rather than the broad rate retreat some shippers may have been planning around.
Frequently Asked Questions
What are ocean freight rates in May 2026?
As of May 12, 2026 (SCFI), Asia to U.S. East Coast spot rates are approximately $3,800 per FEU, and Asia to U.S. West Coast rates are approximately $2,800 per FEU. Asia–North Europe is near $1,500/TEU. Rates are trending upward and tracking carrier capacity discipline more closely than underlying demand.
Why are container shipping rates rising in 2026?
Three forces: blanked sailings around the May Day holiday removed about 25% of TPEB capacity; the Strait of Hormuz closure and Cape of Good Hope routing continue to absorb effective fleet capacity; and fuel costs remain elevated, setting a higher cost floor for ocean carriers.
Which U.S. ports are growing in 2026?
In March 2026, Portland (+44.1% on a very small base),Virginia (+10.0%), Vancouver BC (+9.7%), and Houston (+7.5%) posted the strongest year-over-year inbound TEU growth. Los Angeles and Long Beach remain the largest gateways by absolute volume.
Is the Suez Canal back open for container shipping?
The Strait of Hormuz remains closed and there has been no widespread return of container vessels to Suez routings as of May 2026. Most Asia–Europe and Asia–U.S. East Coast services continue to route around the Cape of Good Hope.
What does TPEB mean in ocean freight?
TPEB stands for Transpacific Eastbound – the trade lane covering containerized cargo moving from Asia to North America. It is the world's largest container trade lane by volume and the primary driver of U.S. import freight rates.
Which ports have the worst congestion right now?
Qingdao is currently the most congested major port, with vessel waits of approximately 4 days. Manila North is seeing 3+ day berth delays. In Europe, Hamburg's yard is running near 89% utilization with ~2 day vessel waits.
Stay Ahead of the Next Market Move
Ocean freight market conditions are evolving faster than weekly carrier advisories can keep up with. SeaVantage's real-time port congestion data, predictive ETAs, and vessel-level visibility help shippers and forwarders make routing, booking, and customer-service decisions with intelligence rather than guesswork.
Want a live view of the metrics in this report? Explore SeaVantage's ocean visibility platform to see real-time port congestion, vessel ETAs, and trade-lane analytics tailored to your routes.

호르무즈 해협 위치부터 세계 원유·LNG 공급망에서의 역할, 이란의 봉쇄 가능성, 한국에 미치는 영향까지 한눈에 정리했습니다. 최신 데이터와 사례를 바탕으로 공급망 리스크를 쉽게 이해해 보세요.

항만 혼잡도는 선박 지연, ETA 정확도, 디머리지 비용에 영향을 미치는 핵심 지표입니다. 발생 원인부터 주요 항만 모니터링 방법까지 확인해 보세요.

호르무즈 해협은 현재 어떤 상황일까요? 2026년 6월 기준 통항 현황, 봉쇄 영향, 유가·해상 운임 변화, 한국 기업 및 공급망 리스크를 분석했습니다.

Carrier ETAs in container shipping are frequently inaccurate. Learn why — and how AI-powered Predicted Time of Arrival (PTA) gives logistics teams an independent, continuously updated second opinion on when cargo will really arrive.

Discover the latest June 2026 ocean freight market trends. Understand the impacts of the US-Iran ceasefire, rising TPEB rates, and early peak season demand on global logistics.

Demurrage isn't a finance problem — it's a visibility problem. Here's a 2026 playbook for tracking container dwell time, catching demurrage risk early, and reducing avoidable charges before they hit the invoice.
.png)