


North America Ocean Freight Market Update: TPEB & ISC (July 2026)
Summary
TPEB peak season is cooling on the West Coast but staying tight on the East Coast and Gulf through August, driven by Panama Canal restrictions and the ongoing Suez Canal closure. ISC to US East Coast capacity has been cut by roughly 28% since June as services are withdrawn faster than demand is softening. The July 10 Strait of Hormuz closure has added acute chokepoint risk on top of both trends. Diversifying across carrier alliances and tracking delay risk in real time both matter more in a market moving this unevenly.
Ocean freight conditions shifted fast in the second quarter of 2026. Transpacific Eastbound (TPEB) rates hit a peak, capacity out of the Indian Subcontinent tightened sharply, and the Strait of Hormuz closed again in early July, adding fresh risk to vessel routing. Here's SeaVantage's read on where capacity and rates stand across TPEB and the Indian Subcontinent (ISC), and what the volatility means for cargo visibility.
The ocean market is cooling on the Pacific but staying tight everywhere else. West Coast capacity has loosened as extra loaders entered the Los Angeles trade, but the East Coast, Gulf, and Indian Subcontinent to US East Coast lane remain constrained into August. The July 10 closure of the Strait of Hormuz has reintroduced routing risk on top of an already tight East Coast and ISC picture.
Global Ocean Capacity Is Growing Faster Than Demand
Fleet capacity is a supply-side story, not a demand signal. Carrier order books placed years ago, including new LNG- and methanol-fueled tonnage built to meet updated fuel rules, keep delivering regardless of current bookings.
Across the top carriers we track, total global fleet capacity grew roughly 2.7% between January and July 2026. Yang Ming led the group with a 5.8% increase, while Zim was the only carrier to shrink its fleet, down 1.6% over the same period.
Because new vessel deliveries aren't tied to present-day demand, carriers lean on two levers to keep utilization high:
- Blank sailings: canceling scheduled voyages to remove capacity
- Vessel idling: parking ships rather than sailing them at a loss
Vessel scrapping has stayed low industry-wide, largely because the Suez Canal closure (see below) keeps more ships in active rotation than would otherwise be the case.
North America Demand Is Recovering, Not Booming
Global container demand fell 2.2% year-over-year in March 2026. By May 2026, that comparison had flipped to a 4.4% year-over-year increase. On the TPEB trade specifically, May 2026 volume was up 21% versus May 2025.
That swing looks dramatic, but it's a recovery off a depressed baseline, not new demand growth. May 2025 volumes were suppressed by tariff-related front-loading and the pullback that followed, so the year-over-year comparison flatters the current numbers. North America still outgrew the rest of the world for the first time in two years, which typically signals inventory restocking rather than a structural demand shift, and often precedes a temporary lull once those inventories are topped off.
Two demand trends are pulling in opposite directions for the second half of 2026:
- Consumer goods demand is expected to soften, in line with IMF projections for reduced discretionary spending
- Tech export corridors are accelerating, driven by AI hardware, data center equipment, and chip shipments
Net, TPEB volume growth should continue into H2 2026, but at a slower pace than the spring peak.
TPEB Rates: Peak Season Is Cooling, But Not Evenly
The Shanghai Containerized Freight Index (SCFI) per FEU climbed steadily from mid-May 2026 through early July as TPEB entered peak season. The first meaningful dip since that run-up showed up in mid-July. July 1 General Rate Increases (GRIs) didn't hold for their full validity window, and most carriers had already filed rate extensions into the second half of July, both signs that peak season pricing power is fading.
That cooling isn't uniform across the coast.
West Coast capacity has real breathing room. Extra loader vessels added into the Los Angeles market through June relieved pressure on Pacific Southwest strings, and utilization, while still high, is no longer overflowing the way it was earlier in the summer.
East Coast and Gulf capacity stays tight through at least August, for three structural reasons:
- Fewer extra loaders have been added to East Coast strings
- Panama Canal draft restrictions continue to limit transits
- The Suez Canal has been closed for roughly three years, forcing East Coast-bound vessels around the Cape of Good Hope and adding 12 to 14 days of transit time per voyage
A handful of extra loaders are starting to enter the East Coast market, which should eventually ease the backlog, but that relief takes time to show up in available space.
Schedule Reliability: The Gap Between Alliances Is Widening
Schedule reliability measures the share of vessel arrivals within 24 hours of the originally published schedule. Sea-Intelligence's Global Liner Performance (GLP) report tracks and publishes it, and it's the industry's standard reference for carrier and alliance on-time performance.
Per Sea-Intelligence's June 2026 report, the Gemini Cooperation (Maersk and Hapag-Lloyd's hub-and-spoke network) posted alliance-level reliability of 93.4% for May/June 2026, well ahead of MSC at 80.7% and Ocean Alliance at 67.6%. Route-level figures we track through the spring showed Gemini running even higher into North America specifically, in the high 90s on both coasts.
The industry average trails both figures by a wide margin, and West Coast reliability consistently outperforms East Coast, consistent with the rerouting, congestion, and Panama Canal constraints already limiting East Coast capacity. Even with alliance-level improvement, Sea-Intelligence's data shows the average delay for late vessel arrivals sitting at 5.31 days as of June 2026, in the same range we're seeing across North American ports.
A high-reliability alliance is still worth diversifying away from. Blank sailings, capacity swings, and the ongoing Suez rerouting make single-carrier dependency risky even when that carrier's headline numbers look strong. Spreading volume across alliances and services protects against the sailings that do go sideways, especially during a capacity-driven market like this one.
Indian Subcontinent to US: The Most Constrained Lane Right Now
The Indian Subcontinent (ISC) to US trade entered its own peak season in June 2026, later than TPEB but arguably tighter. Demand has climbed steadily from June into July, with growth expected to continue into August. At the same time, capacity on the main corridor, Northwest India to the US East Coast, has gone down as demand has gone up.
Two forces are colliding on this lane: a demand rebound and a supply cut.
The demand side. ISC to US demand was suppressed for most of Q4 2025 after Russian energy tariffs were imposed on Indian imports in late August 2025, in response to India's continued purchases of Russian oil. Volumes began recovering in January 2026, then jumped sharply, about 40%, between April and May 2026, and have stayed elevated into the current peak.
The supply side. Two major service strings have left the Northwest India to US East Coast trade in 2026:
- The Indus Express service was removed in early June 2026
- The Wind service is scheduled to conclude at the end of July 2026
Weekly service frequency from the major Northwest India ports, Mundra and Nhava Sheva, to the US East Coast has dropped from six services to four. Remaining services also saw blank sailings and smaller substitute vessels through late June, adding to the capacity loss.
Port-side congestion is adding further delay:
- Indian exporters are competing for space across all destinations, not just the US, tightening berth availability at Mundra, Nhava Sheva, and Colombo
- Monsoon rains are disrupting port operations and inland cargo movement across Western India
The net capacity change is significant. Average weekly capacity across the major Northwest India to US East Coast services was about 38,000 TEU on June 1, 2026, across six services. By August 1, 2026, that figure drops to roughly 28,000 TEU across four services, a reduction of about 10,000 TEU, or roughly 28% of weekly capacity, in two months.
West Coast routings work differently. There are only two direct ISC to US West Coast services; nearly all other ISC cargo bound for the West Coast rides on TPEB service strings instead, so West Coast ISC capacity and pricing move with the broader TPEB market rather than the East Coast-specific crunch.
Capacity is expected to stay tight through at least mid to late August 2026. What happens after that depends heavily on unresolved US-India tariff and trade deal developments, and on whether idle vessels exist to redeploy: industry idle fleet capacity currently sits below 0.5%, leaving little available tonnage to add back into the trade quickly.
The Strait of Hormuz Closure: A New Layer of Ocean Risk
On July 10, 2026, Iran closed the Strait of Hormuz again. Vessel tracking data showed roughly a 60% week-over-week drop in transits through the strait, with an estimated 200,000 TEU of container capacity now restricted or trapped in the region.
This adds a chokepoint risk on top of an already constrained network. Vessels that would normally transit the Strait of Hormuz now face the same kind of rerouting pressure that's kept the Suez Canal closed to traffic for roughly three years, pushing more capacity onto longer, less predictable routings. For any lane touching the Middle East or the wider Indian Ocean, that means longer transit times and less certainty around published schedules, on top of the capacity constraints already squeezing the ISC and East Coast lanes above.
The situation is still developing. Vessel tracking through this chokepoint is worth watching closely over the coming weeks, since further escalation could extend delays beyond the Middle East-adjacent trades and into broader Asia-to-US routings that share vessels or terminal capacity with affected strings.
What This Volatility Means for Cargo Visibility
Blank sailings, service withdrawals, Suez and Hormuz rerouting, and monsoon-driven port delays all share one effect: they widen the gap between a carrier's originally published ETA and when a container actually arrives. A carrier's own ETA reflects the schedule filed at booking; it doesn't automatically update as blank sailings, congestion, or rerouting accumulate mid-voyage.
That's the problem SeaVantage's Cargo Insight platform is built to flag early. Its Predicted Time of Arrival (PTA) is meant to complement carrier ETAs, not replace them. It surfaces early delay-risk signals as conditions change, so teams planning around an East Coast arrival or an ISC service string aren't finding out about a delay only when the vessel is already late. In a market shifting this fast between coasts and trade lanes, catching that risk early matters more than usual.
People Also Ask
Why did TPEB rates spike in mid-2026?
TPEB entered peak season around mid-May 2026, driven by demand recovery off a tariff-depressed 2025 baseline. Rates began cooling in early July as July 1 GRIs failed to hold their full validity period.
How much has Indian Subcontinent ocean capacity to the US dropped?
Weekly capacity from Northwest India to the US East Coast fell from about 38,000 TEU across six services on June 1, 2026, to roughly 28,000 TEU across four services by August 1, 2026, about a 28% reduction.
Why is the East Coast more congested than the West Coast right now?
Fewer extra loader vessels, Panama Canal draft restrictions, and the multi-year Suez Canal closure, which forces East Coast-bound vessels around the Cape of Good Hope and adds 12 to 14 days of transit, all concentrate pressure on East Coast capacity specifically.
What caused the Strait of Hormuz closure in July 2026?
Iran closed the Strait of Hormuz on July 10, 2026, amid renewed regional hostilities, cutting vessel transits by roughly 60% week-over-week and restricting an estimated 200,000 TEU of container capacity.
Is the Gemini Cooperation the best choice for schedule reliability?
Gemini's reported reliability (around 97 to 98% on North American routes this spring, 93.4% on Sea-Intelligence's alliance-level June 2026 figures) leads the market, but relying on a single alliance still carries risk during blank-sailing-heavy periods. Diversifying across alliances is the standard risk mitigation approach.
How long will the Suez Canal stay closed?
The Suez Canal has been closed to most container traffic for roughly three years as of mid-2026, with no confirmed reopening timeline, keeping East Coast-bound vessels on the longer Cape of Good Hope routing.
FAQ
Q: What is schedule reliability in ocean freight?
Schedule reliability is the percentage of vessel arrivals that occur within 24 hours of the originally published schedule. It's tracked industry-wide by Sea-Intelligence's Global Liner Performance report.
Q: What is the difference between ETA and PTA in shipment tracking?
ETA (Estimated Time of Arrival) is the schedule a carrier files at booking. PTA (Predicted Time of Arrival) is a dynamically updated prediction that factors in real-time conditions like blank sailings, congestion, and rerouting, and flags delay risk before the carrier's ETA changes.
Q: How long will Indian Subcontinent capacity constraints last?
Based on current service withdrawals and demand trends, capacity is expected to stay constrained into at least mid to late August 2026. Conditions beyond that depend on unresolved US-India tariff negotiations and the limited pool of idle vessels available for redeployment.
Q: What is a blank sailing?
A blank sailing is a scheduled vessel voyage that a carrier cancels, typically to manage overcapacity or align supply with softer demand on a given trade lane.

팬스타 아크로호가 지난 8월 22일 북극항로 시범운항을 시작했습니다. 국내 최초 컨테이너선 북극항로 운항 현황과 상업성 검증 항목, 화주·포워더가 주목할 사항을 정리합니다.
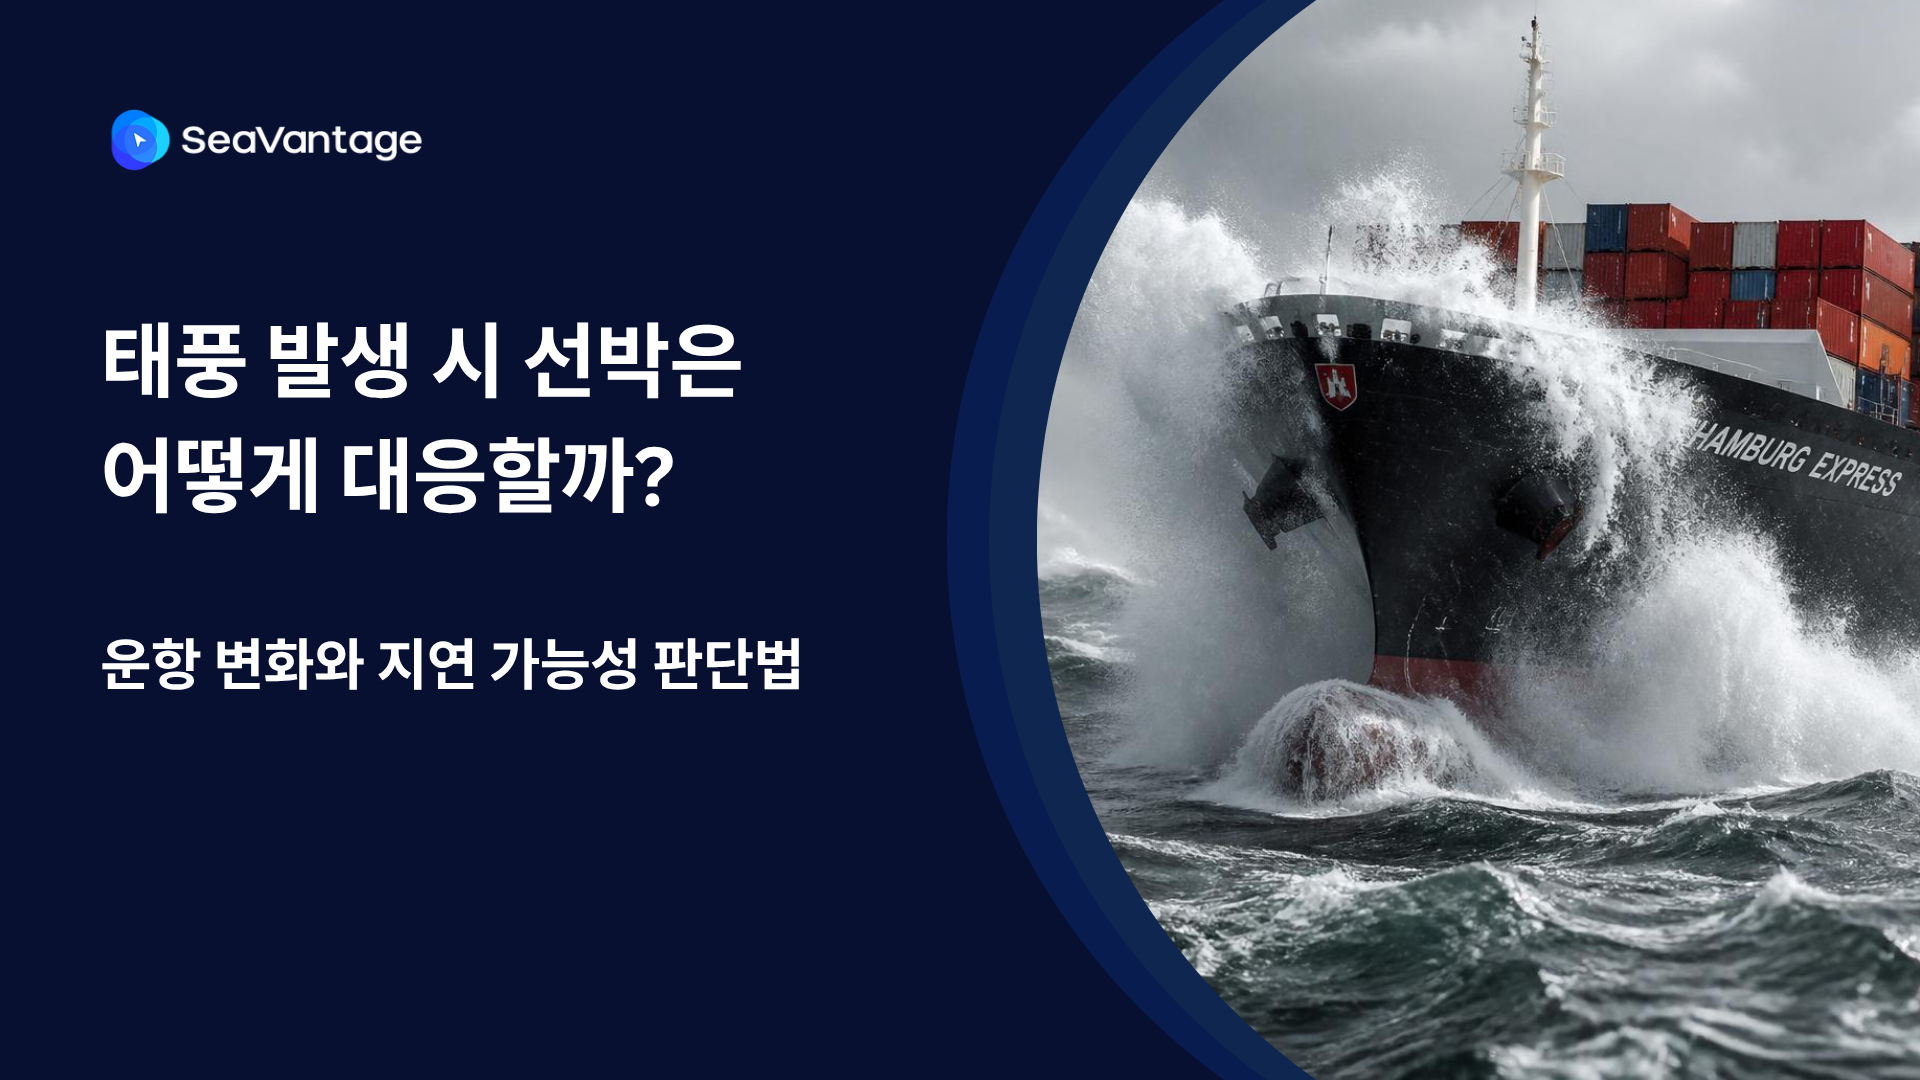
태풍 발생 시 선박은 우회·감속·대기 등 서로 다르게 대응합니다. AIS 항적과 ETA·PTA·PTB, 항만 혼잡 데이터를 활용해 해상운송 지연 가능성을 판단하는 방법을 알아보세요.
Need a SeaRates alternative? See how SeaVantage Cargo Insight supports container tracking, predicted arrivals, shipment milestones, and API access.
TPEB rates 2026, Indian Subcontinent ocean freight capacity, Strait of Hormuz shipping disruption, schedule reliability ocean carriers
What's driving ocean freight peak season 2026 — rates, surcharges, booking windows, and how to avoid missed inventory deadlines.

.png)


