
Container Vessel Dwell Time by Carrier – September 2025 Analysis
Context and Scope of Dwell Time Performance Metrics
This dashboard provides a detailed, data-driven view of average vessel dwell times by shipping line. Dwell time is broken down into two key components, waiting time and working time at berth, offering a clear picture of carrier performance at major global ports.
The current analysis focuses on September 2025, with comparisons to August 2025 (MoM) and September 2024 (YoY) to highlight monthly fluctuations and broader yearly trends.
The analysis centers on 10 high-traffic container ports: Antwerp, Busan, Jebel Ali, Los Angeles, Long Beach, Ningbo, Rotterdam, Savannah, Singapore and Shanghai. SeaVantage maintains vessel dwell time data across all global container ports. If you're interested in accessing the full dataset or customized reports, please feel free to contact us directly.
Actionable Insights
This dashboard helps identify which carriers are experiencing increasing delays, where operational efficiency is improving or declining, and how recent disruptions may be affecting global port activity. These insights support smarter port selection and more informed carrier negotiations.
Breakdown of Carrier Dwell Times – September 2025
In September 2025, Busan and Singapore remained the benchmarks for efficiency. Operations in these key Asian hubs were exceptionally smooth, as the vast majority of shipping lines experienced zero vessel waiting time. Coupled with consistently low and predictable working times, this points to highly effective terminal management and fluid berthing processes.
On the other hand, significant waiting-time congestion was evident at major Asian and US East Coast ports during the month. Hapag-Lloyd faced extensive delays at both Shanghai and Savannah, recording an identical and exceptionally high waiting time of 57.3 hours at each port. Savannah also showed signs of strain with Wan Hai Lines waiting for over 50 hours, while Zim waited for 52 hours at Shanghai before berthing.
The story on the US West Coast is one of severe terminal-side delays rather than anchorage congestion. The ports of Los Angeles and Long Beach were characterized by extraordinarily prolonged working times. While most vessels get to their berths quickly, operations are lengthy. Maersk at Los Angeles spent 166 hours at berth, and HMM spent 163 hours there, indicating significant throughput challenges.
The situation at Long Beach was even more pronounced and showed the most significant systemic bottleneck in the September data. Zim recorded a staggering working time of 254 hours, with ONE (Ocean Network Express) not far behind at 233 hours. These are by far the longest working periods in this analysis and suggest critical operational issues at their respective terminals.
In Long Beach, CMA CGM stands out as a unique anomaly. While most carriers at the port experienced little to no waiting, CMA CGM faced a high waiting time of 52.7 hours, pointing to a specific issue impacting their vessel berthing rather than port-wide congestion.
Finally, at Savannah, Yang Ming Marine Transport Corp. faced a notable total dwell time of over 103 hours. This was driven by a problematic combination of a very long waiting period (35.4 hours) and an extended working time (68 hours), indicating systemic issues for the carrier at that port.
Month-over-Month Change in Carrier Dwell Times by Port
Year-over-Year Change in Carrier Dwell Time by Port
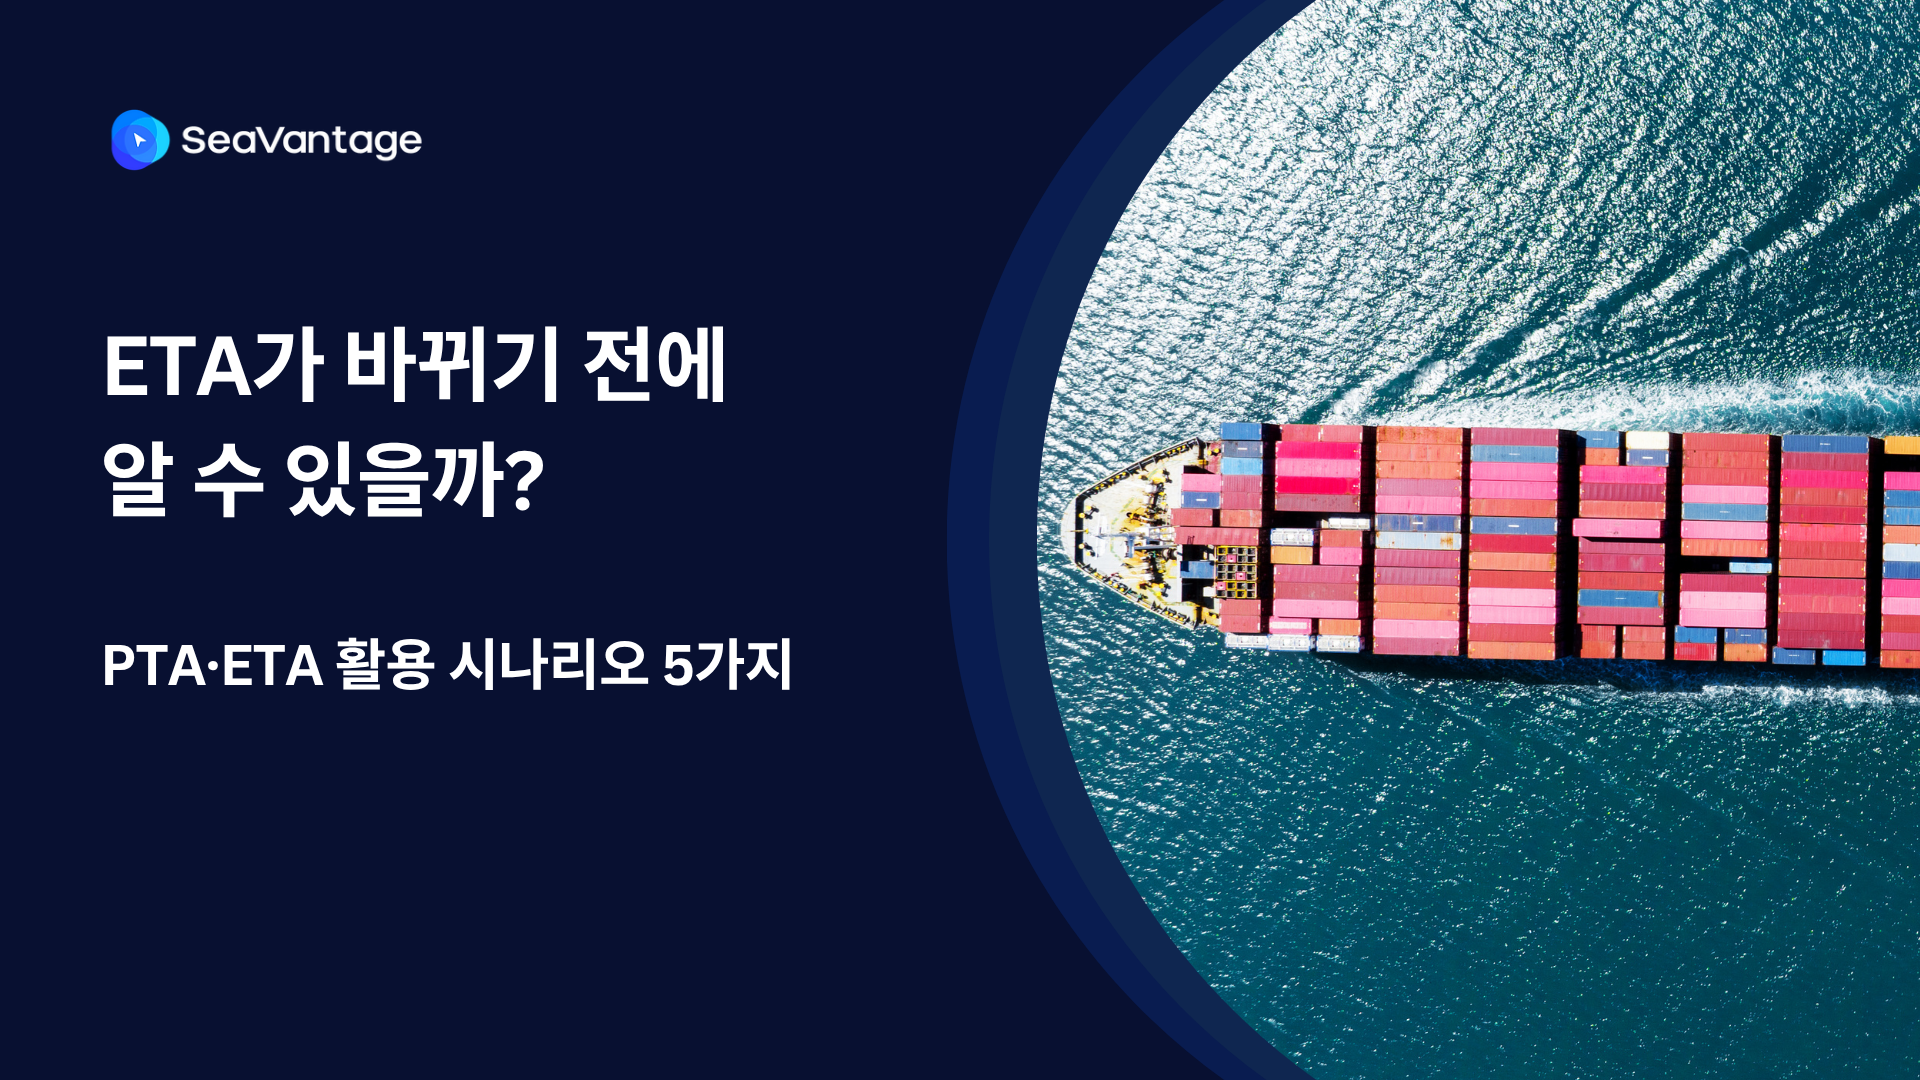
선사 ETA가 바뀌기 전에 일정 변동 가능성을 미리 파악할 수 있을까요? PTA와 ETA의 차이, 구간별 확인 방법, 실무 대응 시나리오 5가지를 소개합니다.
ETA(Estimated Time of Arrival) 뜻과 ETD·ATA와의 차이, ETA가 실제 도착 시간과 달라지는 이유를 알아보세요. ETA 변동에 대응하는 방법과 SeaVantage PTA 활용법도 함께 소개합니다.

호르무즈 해협 위치부터 세계 원유·LNG 공급망에서의 역할, 이란의 봉쇄 가능성, 한국에 미치는 영향까지 한눈에 정리했습니다. 최신 데이터와 사례를 바탕으로 공급망 리스크를 쉽게 이해해 보세요.

PTA is SeaVantage's predictive signal for ocean freight visibility. Learn how to read PTA alongside ETA, leg by leg, to catch delays before they happen.
A practical RFP checklist for evaluating ocean freight and container visibility API vendors — data accuracy, integration, security, SLAs, and partnership fit.
Should your firm build, buy, or partner for container and ocean freight visibility on client engagements? A practical framework for consulting and SI firms.
.png)