
Major Ports in the United States and North America: Rankings, Capacities & Global Impact 2025
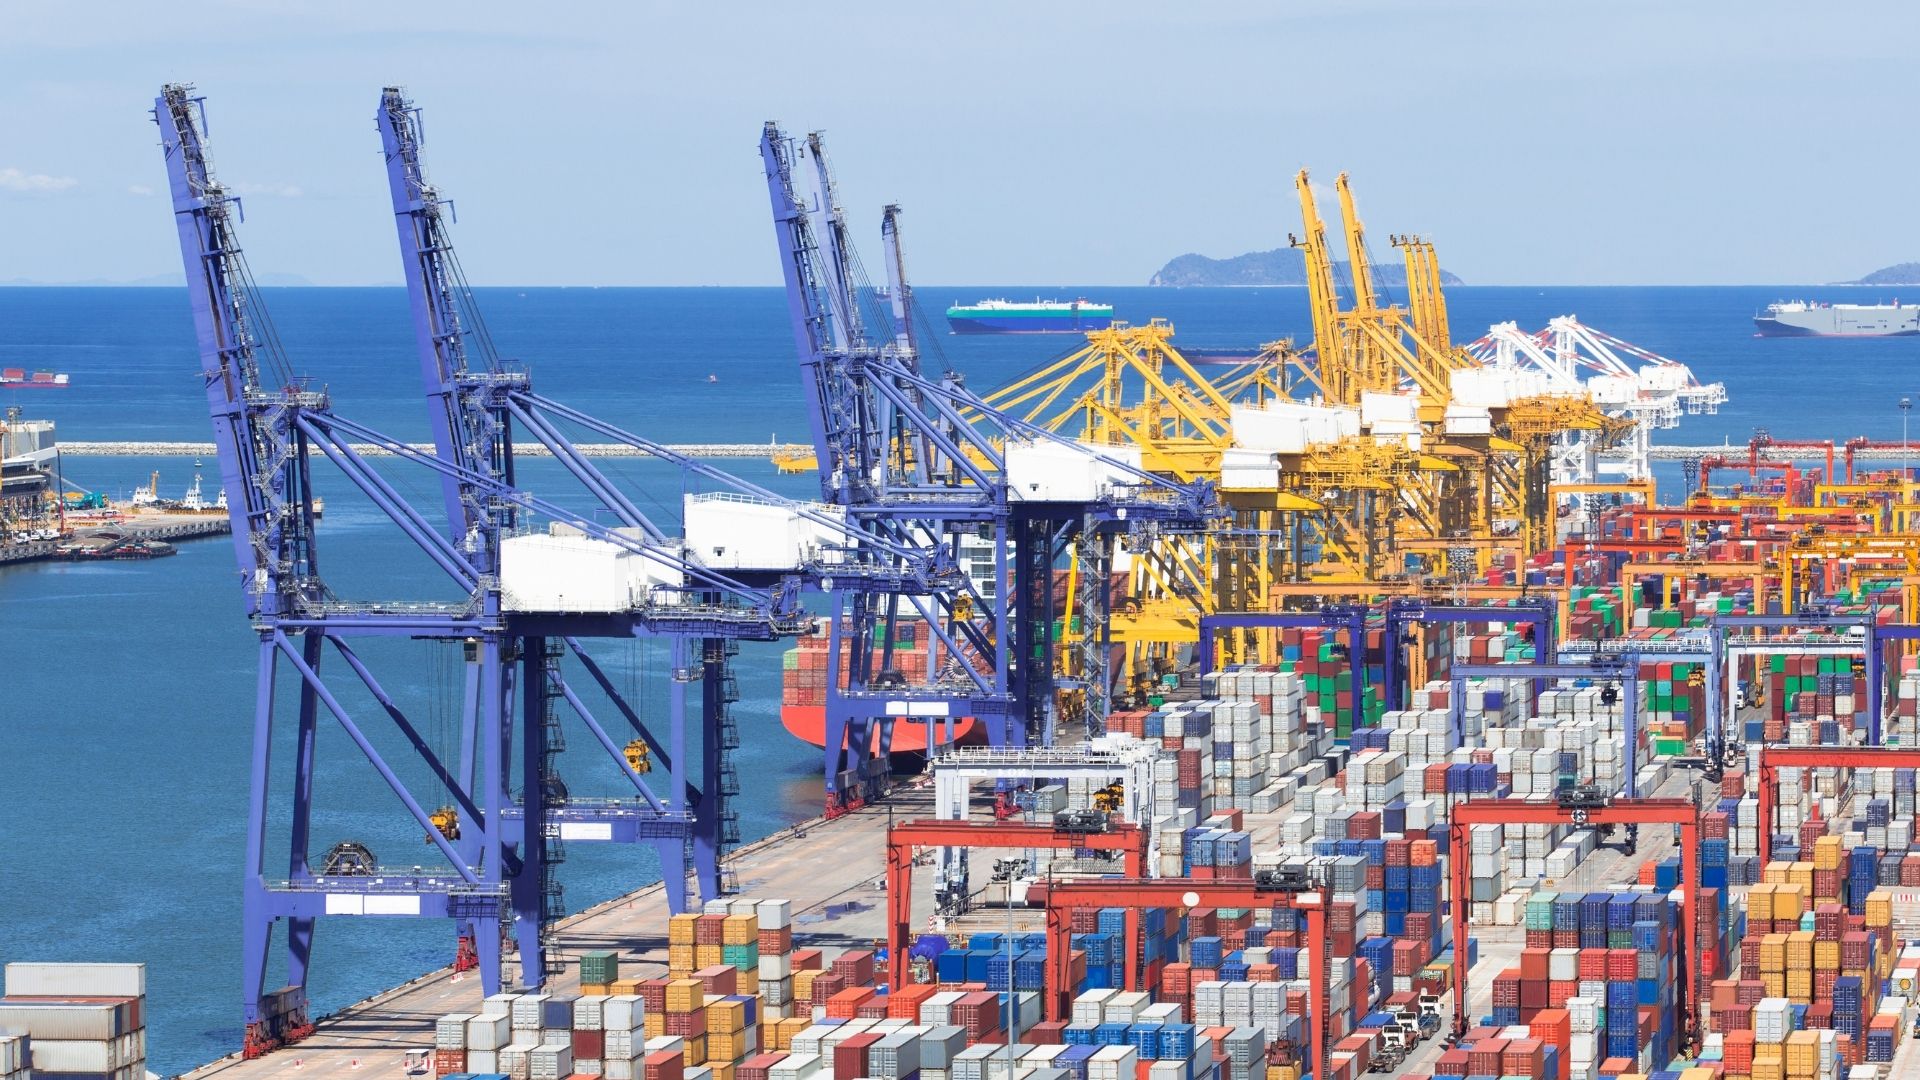
When you think of global trade, the first names that come to mind are often ports like Los Angeles or New York. But what makes these major ports in the United States truly stand out? It's scale, infrastructure, technological innovation—and their undeniable influence on the international supply chain.
In this guide, we’ll dive into the top U.S. and North American ports in 2025. We’ll look at capacity, throughput, ongoing expansions, and their strategic roles—then wrap it all in context with freight trends, geopolitics, and ecosystem-wide impacts.
Top 5 Major Ports in the U.S.
Port of Los Angeles, CA
In 2024, the Port of Los Angeles retained its title as the nation’s busiest container hub—processing an impressive 9.4 million TEUs in the first 11 months, a 19% rise year-over-year.
Three new cranes capable of handling “Mega-EMAX” ships (up to 18,000 TEU) arrived in late 2024—a strategic investment in future capacity.
Port of Long Beach, CA
Just south of LA, Long Beach managed about 8.8 million TEUs over the first 11 months of 2024—an extraordinary 20.2% growth from 2023. In August alone, over 913,000 TEUs passed through—a record in the port’s 113-year history.
Port of New York & New Jersey
Leading the East Coast, this port moved 7.2 million TEUs in 2024, cementing its position as North America’s third-busiest container gateway. Further, the port is taking a more aggressive stance on infrastructure revenue—negotiating terminal sales and tenant contributions to accelerate upgrades.
Port of Savannah, GA
Savannah handled around 5.1 million TEUs in 2024, supporting strong gains in April and May—driven by significant federal investment in electricity and infrastructure.
Port of Houston, TX
Rounding out the top five, Houston processed approximately 3.8 million TEUs in 2024. With its deepwater channels (45 ft draft) and sprawling petrochemical logistics network, Houston remains an essential exporter hub.
Other Key Ports in North America
Port of Charleston, SC
Charleston ranks among the U.S. top six by cargo value. In fiscal year 2021, it processed 2.85 million TEUs, with water channel depths recently expanded to 52 ft—the deepest on the U.S. East Coast.
Port of Vancouver, BC (Canada)
North America’s fourth-largest by tonnage, Vancouver handled 3.5 million TEUs and 141 million metric tons in 2024—anchoring Pacific trade between Asia and North America .
Port of Brunswick, GA
In early 2025, Brunswick surpassed Baltimore to become the nation’s busiest port for automobiles, heavy machinery, and farm equipment—based on 2024 throughput.
Port Miami, FL
While best known for cruise traffic (1.5 million+ passengers in 2024), PortMiami also moves nearly 10 million tons of cargo annually, ranking as Florida’s leading container port.
US Port System: Scale & Investment
- In 2023, U.S. ports handled 743 million tons of cargo and accounted for 41.5% of the value in U.S. international trade—about $2.1 trillion.
- Over 21.8 million U.S. jobs are supported by maritime commerce.
- Under the 2021 Infrastructure Investment & Jobs Act, federal funding for ports nearly doubled: $450 million annually to better develop waterside and landside infrastructure.
- Ongoing challenges include dredging needs, rising sea levels (+10–12 inches projected in 30 years), and climate-driven disruptions.
Trade Routes & Operational Dynamics
- West Coast congestion surged 20–30% in 2024 due to reshoring trends and alliance shifts—triggering blank sailings and delays
- East and Gulf Coast ports are seeing increasing import share, rising to 44.6% of national TEU volume by May 2024.
- U.S.–China trade remains key: May 2024 saw 890,760 TEUs of Chinese-origin goods—up 17.6% from April.
- Policy volatility persists: recent Trump-era tariff threats have caused volume dips of up to 35% at LA and Long Beach .
Conclusion & Future Outlook
America’s major ports United States network is strong, adaptive—and technologically evolving. From LA to Savannah, strategic investments—cranes, deeper channels, revenue reforms, federal grants—are modernizing the system.
Challenges remain: congestion, climate risks, geopolitical policies. But ports are responding with digital tools, deepening projects, and diversified routing to stay resilient.
In 2025 and beyond, these ports will continue anchoring the North American economy, refining operations, and reinforcing supply-chain reliability in an uncertain world.
Frequently Asked Questions (FAQ)
1. Which are the major ports in the United States by container volume in 2025?
The major U.S. ports by container volume in 2025 include the Port of Los Angeles, Port of Long Beach, Port of New York & New Jersey, Port of Savannah, and Port of Houston. These ports handle millions of TEUs annually and are critical hubs for international trade.
2. How much cargo do the busiest U.S. ports handle annually?
In 2024, the busiest ports like Los Angeles and Long Beach processed over 9 million and 8.8 million TEUs respectively, contributing significantly to the U.S. maritime cargo throughput of over 743 million tons.
3. What technological innovations are U.S. ports adopting to increase capacity?
U.S. ports are investing in mega-cranes capable of handling 18,000+ TEU ships, implementing digital tracking and automation systems, and enhancing infrastructure such as deeper channels and terminal expansions to improve efficiency.
4. How are U.S. ports addressing congestion and climate challenges in 2025?
Ports are leveraging advanced digital tools for better traffic management, expanding dredging projects to deepen channels, and investing in resilience strategies against rising sea levels and climate disruptions.
5. What impact does federal funding have on U.S. port infrastructure development?
Since the 2021 Infrastructure Investment & Jobs Act, federal funding for ports has nearly doubled, with about $450 million annually allocated to improve waterside and landside infrastructure, boosting port capacity and modernization efforts.
6. How are trade dynamics between the U.S. and China affecting port throughput?
Trade with China remains pivotal, with significant volumes of Chinese-origin goods moving through major ports. Despite some tariff-related dips, container volumes have shown recovery and growth in 2024 and 2025.
7. Why are East Coast and Gulf Coast ports gaining more market share?
Rising import shares and reshoring trends have shifted some cargo volumes from congested West Coast ports to East and Gulf Coast ports, increasing their importance in the North American logistics network.
8. What are the future growth prospects for the Port of Savannah and Port of Houston?
Both ports are expanding capacity through federal investments and infrastructure projects—Savannah with electrical upgrades and deepening channels, Houston with its deepwater access and petrochemical export facilities—positioning them for continued growth.
9. How do major North American ports compare in terms of global impact?
Ports like Vancouver in Canada and U.S. ports like Los Angeles and New York serve as critical gateways linking Asia, Europe, and the Americas, playing strategic roles in global supply chains and international freight movement.
10. What are the key challenges facing U.S. ports in maintaining supply chain reliability?
Challenges include managing congestion, adapting to climate change impacts, navigating geopolitical trade policies, and sustaining infrastructure investment to keep pace with growing cargo volumes.

선사 ETA가 바뀌기 전에 일정 변동 가능성을 미리 파악할 수 있을까요? PTA와 ETA의 차이, 구간별 확인 방법, 실무 대응 시나리오 5가지를 소개합니다.
ETA(Estimated Time of Arrival) 뜻과 ETD·ATA와의 차이, ETA가 실제 도착 시간과 달라지는 이유를 알아보세요. ETA 변동에 대응하는 방법과 SeaVantage PTA 활용법도 함께 소개합니다.

호르무즈 해협 위치부터 세계 원유·LNG 공급망에서의 역할, 이란의 봉쇄 가능성, 한국에 미치는 영향까지 한눈에 정리했습니다. 최신 데이터와 사례를 바탕으로 공급망 리스크를 쉽게 이해해 보세요.

PTA is SeaVantage's predictive signal for ocean freight visibility. Learn how to read PTA alongside ETA, leg by leg, to catch delays before they happen.
A practical RFP checklist for evaluating ocean freight and container visibility API vendors — data accuracy, integration, security, SLAs, and partnership fit.
Should your firm build, buy, or partner for container and ocean freight visibility on client engagements? A practical framework for consulting and SI firms.
.png)