


Factors Impacting Container Dwell Time in Shipping 2025

Introduction
Container dwell time—the total time a container remains at a port terminal between arrival and departure—is a critical metric in global shipping. It directly affects supply chain efficiency, operating costs, and ultimately, the timeliness of goods reaching their destination. For shippers, carriers, and logistics providers alike, minimizing dwell time is a top priority.
Yet, container dwell time remains influenced by a complex interplay of factors, many of which vary widely across ports, carriers, and regions. Recent data from SeaVantage’s June 2025 Container Vessel Dwell Time Analysis reveals how some ports like Busan excel in keeping vessel wait and working times low, while others such as Shanghai and Long Beach experience congestion-induced delays exceeding 100 hours.
Understanding these factors is essential to improving supply chain resilience and cost-effectiveness. This article explores the main contributors to container dwell time and outlines strategies that can help mitigate their impact.
1. Port Congestion and Infrastructure
One of the most significant contributors to container dwell time is congestion within port facilities. Limited berth availability, insufficient crane capacity, and lack of storage space create bottlenecks that extend vessel waiting and working times.
Ports facing infrastructure constraints often struggle to handle increasing cargo volumes efficiently. For example, SeaVantage data shows that Shanghai and Ningbo are experiencing combined waiting and working times frequently exceeding 70–80 hours. The long anchorage delays indicate vessels must queue offshore, waiting for available berths.
By contrast, ports like Busan report zero waiting times and working times generally below 30 hours, demonstrating how modern infrastructure and efficient terminal operations can keep dwell times low.
Infrastructure upgrades such as expanded berth capacity, automated crane operations, and optimized yard management can alleviate congestion. However, these improvements require significant capital investment and long-term planning.
2. Customs and Regulatory Delays
Beyond physical port capacity, customs clearance and regulatory inspections significantly affect container dwell time. In many countries, complex documentation requirements and procedural bottlenecks slow down cargo release.
Inspection protocols vary widely depending on the nature of the goods, origin, and destination countries’ policies. In some regions, manual processing remains prevalent, increasing the risk of delays and errors.
Delays in customs can cause containers to remain in the terminal longer, increasing storage costs and potentially incurring demurrage fees. Shippers and freight forwarders must navigate differing regulatory environments to minimize clearance delays.
The ability to integrate digital customs clearance systems with port operations can streamline documentation flow and reduce dwell time. This approach, however, depends heavily on government adoption and interoperability with private sector systems.
3. Inefficiencies in Inland Transportation
Container dwell time also reflects challenges beyond the port itself. The movement of containers from ports to inland destinations depends on trucking, rail, and barge networks. Shortages in trucking capacity or rail delays can create downstream backups.
Coordination between terminal operators and hinterland transport providers is crucial. When trucks arrive late or in uncoordinated surges, it leads to yard congestion, longer container dwell times, and inefficient terminal operations.
Recent reports highlight trucking shortages in key logistics hubs, exacerbating dwell time issues. Rail infrastructure bottlenecks similarly affect the timely evacuation of containers from ports.
To reduce dwell times, ports and supply chains must improve synchronization between maritime and inland transport modes, employing data-driven scheduling and booking systems.
4. Technology and Data Visibility
A lack of real-time container tracking and data visibility contributes significantly to operational inefficiencies. Without accurate, timely information on container location and status, stakeholders struggle to plan and coordinate effectively.
Emerging technologies such as IoT sensors, GPS tracking, and APIs enable continuous monitoring of containers and vessels. Digital freight platforms aggregate this data, offering a comprehensive view across the supply chain.
SeaVantage’s own platform exemplifies how integrating predictive analytics with live data can alert operators to potential delays and enable proactive management. This digital visibility reduces uncertainty, shortens dwell times, and supports better resource allocation.
However, technology adoption remains uneven across ports and carriers, limiting the full potential benefits.
5. Shipping Line and Terminal Operator Policies
Container dwell time is also shaped by policies around free time allowances and demurrage charges imposed by shipping lines and terminal operators. Free time is the permitted period a container can remain at the terminal without incurring additional fees.
Variations in free time rules and handling procedures among carriers influence how quickly containers are moved. For instance, the SeaVantage June 2025 data shows significant disparities in dwell time by carrier and port. ONE’s unusually long working time at Long Beach (142 hours) may reflect operational inefficiencies or scheduling issues.
Some carriers offer extended free time to incentivize faster pick-up, while others impose steep demurrage fees, pressuring shippers to expedite container removal. Understanding these policies is essential for managing costs and minimizing delays.
6. Supply Chain Disruptions
Global events such as pandemics, labor strikes, geopolitical tensions, and natural disasters can dramatically impact container dwell times. Disruptions to workforce availability and port operations reduce terminal throughput capacity.
For example, labor shortages at terminals can slow crane operations and container handling. Prolonged strikes or political unrest in strategic ports further exacerbate delays.
Supply chain disruptions also ripple through hinterland transport and customs processes, compounding dwell time issues. These unpredictable events underscore the need for resilient, flexible supply chains.
7. Mitigation Strategies
Reducing container dwell time requires a multi-faceted approach combining technology, process optimization, and collaboration.
- Automation: Automated stacking cranes and gate operations speed up container handling and reduce human error.
- Digital Platforms: Platforms like SeaVantage provide real-time visibility and predictive analytics, enabling stakeholders to anticipate delays and optimize scheduling.
- Predictive Analytics: Using historical and real-time data to forecast congestion allows proactive measures, such as re-routing or adjusting berth assignments.
- Collaboration: Sharing data among carriers, terminal operators, customs, and inland transport providers improves coordination and reduces bottlenecks.
Successful case studies include ports that have implemented integrated digital systems and streamlined customs processes, resulting in measurable dwell time reductions. For more practical guidance, see our article on 5 Proven Ways to Reduce Dwell Time with SeaVantage Data.
Conclusion
Container dwell time remains a complex challenge influenced by port infrastructure, customs protocols, inland transportation efficiency, technology adoption, carrier policies, and external disruptions. SeaVantage’s June 2025 dwell time analysis reveals stark contrasts between efficient ports like Busan and congested hubs such as Shanghai and Long Beach.
Addressing these issues demands proactive collaboration across the supply chain and embracing technology-driven solutions to enhance transparency and predictability.
For those interested in detailed monthly and yearly dwell time trends by carrier and port, we invite you to explore our full reports, including the latest Container Vessel Dwell Time June 2025 Analysis and historical benchmarking in our May 2025 Dwell Time by Carrier and Port article.
Moving forward, leveraging data-driven insights will be crucial to managing container dwell time effectively, reducing costs, and building resilient global supply chains.
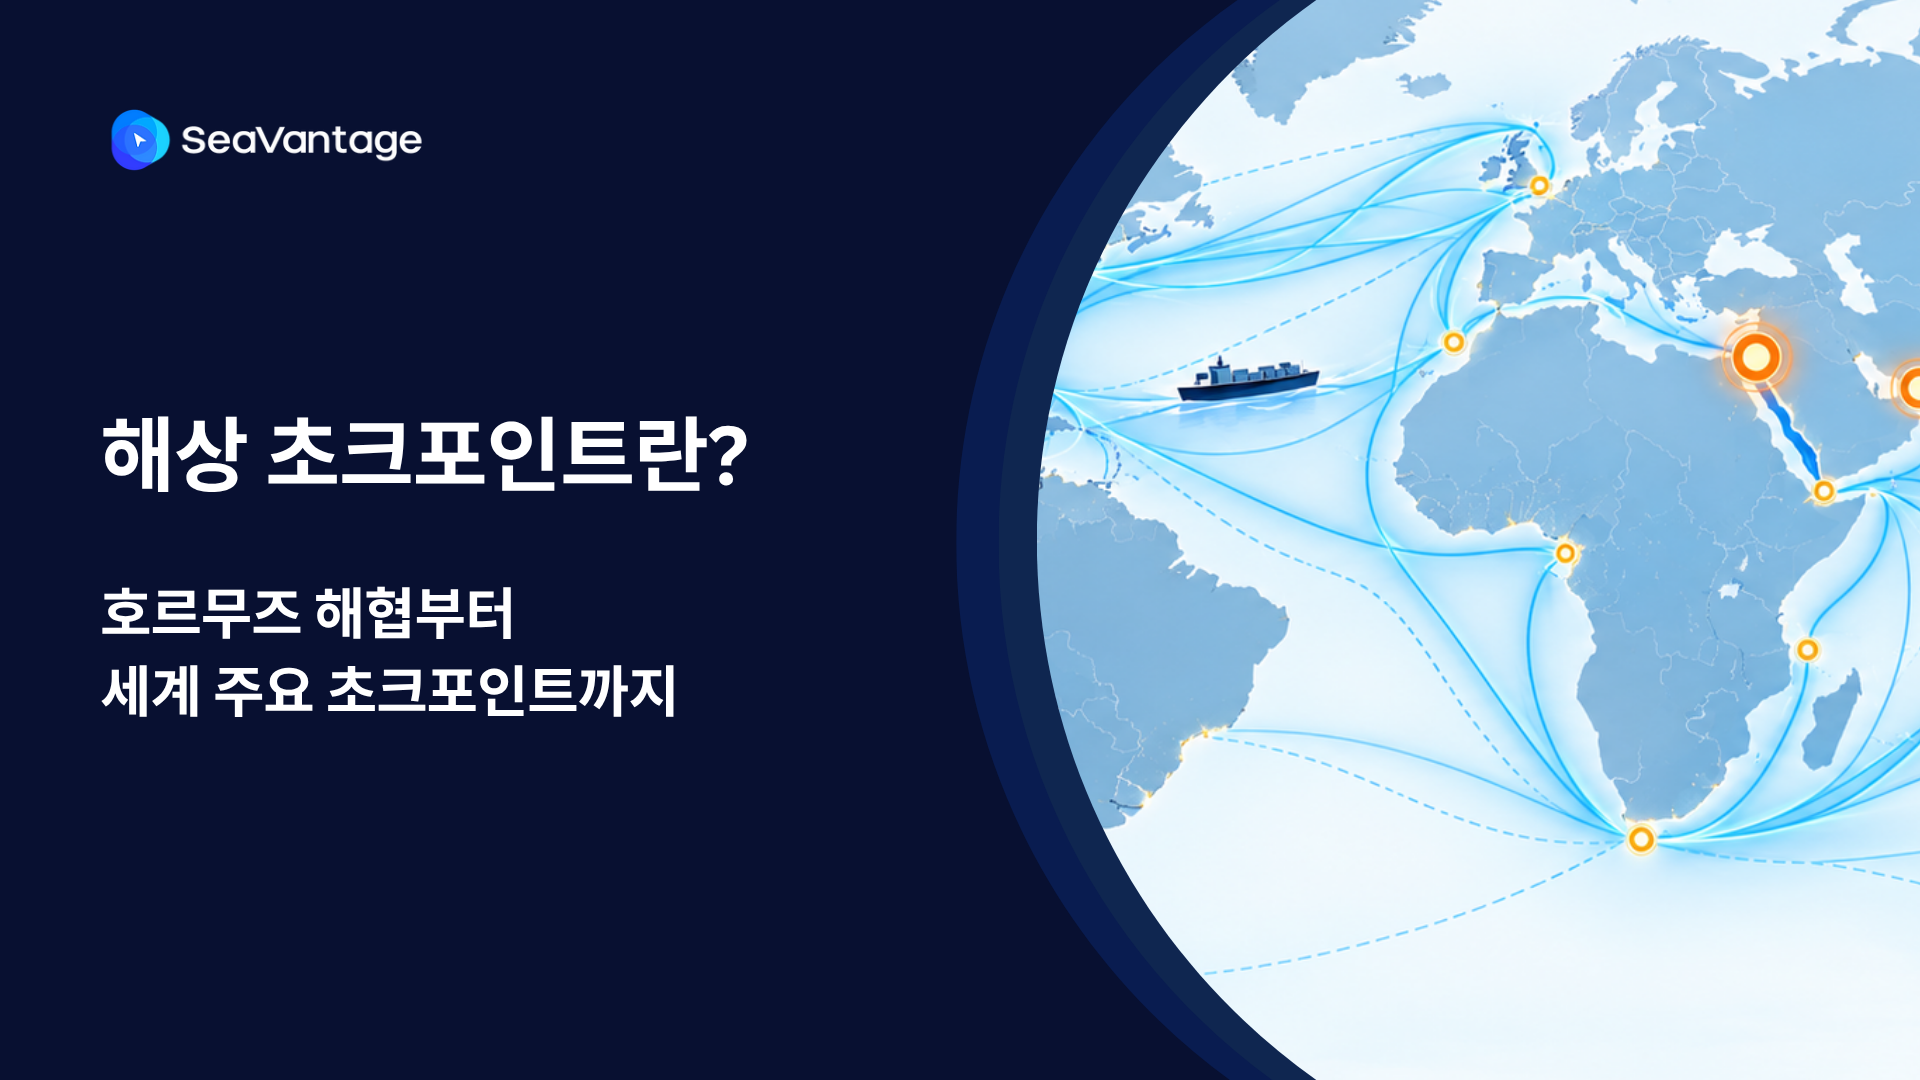

팬스타 아크로호가 지난 8월 22일 북극항로 시범운항을 시작했습니다. 국내 최초 컨테이너선 북극항로 운항 현황과 상업성 검증 항목, 화주·포워더가 주목할 사항을 정리합니다.
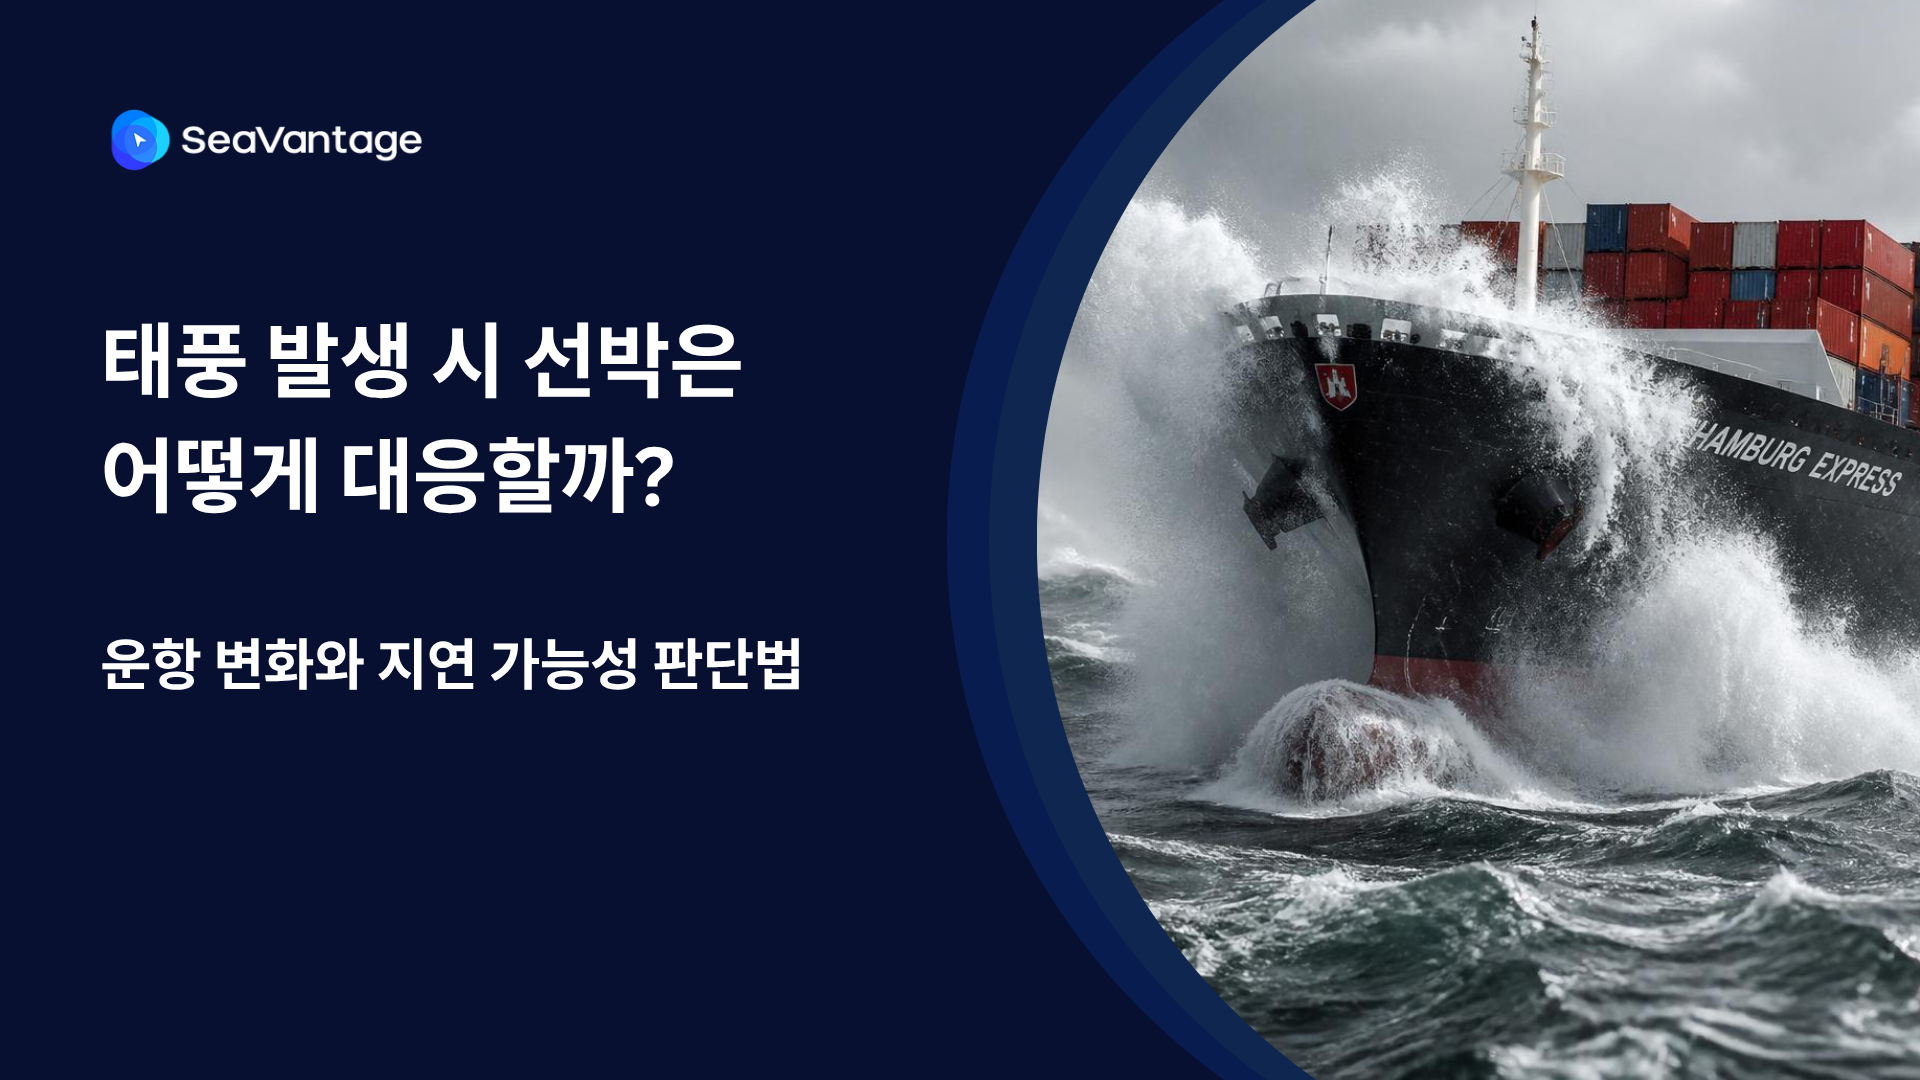
태풍 발생 시 선박은 우회·감속·대기 등 서로 다르게 대응합니다. AIS 항적과 ETA·PTA·PTB, 항만 혼잡 데이터를 활용해 해상운송 지연 가능성을 판단하는 방법을 알아보세요.
Need a SeaRates alternative? See how SeaVantage Cargo Insight supports container tracking, predicted arrivals, shipment milestones, and API access.
TPEB rates 2026, Indian Subcontinent ocean freight capacity, Strait of Hormuz shipping disruption, schedule reliability ocean carriers
What's driving ocean freight peak season 2026 — rates, surcharges, booking windows, and how to avoid missed inventory deadlines.

.png)


